Problem
In my previous article I revisited the concept of a calendar table, and explained some ways to use this data for business date calculations. This time, I wanted to explore how you can use the calendar table to simplify generating date ranges, and some query challenges this can help you simplify.
Solution
Recall that our calendar table has a key column called TheDate:
CREATE TABLE dbo.Calendar<br />(<br /> TheDate date NOT NULL,<br /> …<br /> CONSTRAINT PK_Calendar PRIMARY KEY (TheDate),<br /> …
To generate a series of dates from that table, we can just use a closed-ended range, as follows:
DECLARE @Start date = '20200101', @End date = '20200105';
SELECT TheDate <br />  FROM dbo.Calendar<br />  WHERE TheDate >= @Start<br />    AND TheDate <= @End;
Results:
TheDate
----------
2020-01-01
2020-01-02
2020-01-03
2020-01-04
2020-01-05
And the plan for that query is about as simple as you could imagine:

For convenience, though, we can wrap this in an inline table-valued function:
CREATE FUNCTION dbo.GenerateDateSeries <br />(<br /> @StartDate date,<br /> @EndDate date<br />)<br />RETURNS TABLE<br />WITH SCHEMABINDING<br />AS<br /> RETURN <br /> (<br /> SELECT TheDate<br /> FROM dbo.Calendar<br /> WHERE TheDate >= @StartDate<br /> AND TheDate <= @EndDate<br />);<br />GO
Now the same query is easier to generate (on its own, or to combine with other queries):
DECLARE @Start date = '20200101', @End date = '20200105';
SELECT TheDate <br />  FROM dbo.GenerateDateSeries (@Start, @End);
Same results, same plan, same performance.
But how else can we use this function?
Filling Date Gaps
One of the more popular reasons for generating a date range is to fill gaps in reports. Let’s create a transactional table in a database called SalesStuff and populate it with fictitious data that contains intentional gaps:
USE SalesStuff;<br />GO
DROP TABLE IF EXISTS dbo.Transactions;<br />GO
CREATE TABLE dbo.Transactions<br />(<br />  KeyColumn   int NOT NULL, <br />  EventTime   datetime2(3), <br />  CONSTRAINT  PK_Transactions PRIMARY KEY(KeyColumn),<br />  INDEX       IX_Transactions_EventTime(EventTime)<br />);<br />GO
;WITH x(n) AS<br />(<br />  SELECT TOP (40000) ROW_NUMBER() OVER (ORDER BY o.object_id) <br />    FROM master.sys.all_objects AS o <br />    CROSS JOIN master.sys.all_objects AS o2<br />)<br />INSERT dbo.Transactions(KeyColumn, EventTime)<br />SELECT TOP (10000) n, TheDate = DATEADD(HOUR, n*2, '20200101')<br />  FROM x <br />  WHERE ((n+1)/10) % 3 = 0 <br />  ORDER BY n;
If we just manually look at the transaction table for the first 8 days, we see that there are some days with rows missing:
SELECT KeyColumn, EventTime<br /> FROM dbo.Transactions<br /> WHERE EventTime < '20200109';
Abridged results:
KeyColumn   EventTime
---------   ----------------
1           2020-01-01 02:00
…
8           2020-01-01 16:00
29          2020-01-03 10:00
…
35          2020-01-03 22:00
36          2020-01-04 00:00
37          2020-01-04 02:00
38          2020-01-04 04:00
59          2020-01-05 22:00
60          2020-01-06 00:00
…
67          2020-01-06 14:00
68          2020-01-06 16:00
89          2020-01-08 10:00
…
You can see that there is no data for January 2nd or January 7th. But if someone were to run a simple report to get daily sales for those 8 days:
DECLARE @Start date = '20200101', @End date = '20200108';
SELECT TheDate = CONVERT(date, EventDateTime), TransactionCount = COUNT(*)<br />  FROM SalesStuff.dbo.Transactions<br />  WHERE EventDateTime >= @Start<br />    AND EventDateTime <  DATEADD(DAY, 1, @End)<br />  GROUP BY CONVERT(date, EventDateTime)<br />  ORDER BY TheDate;
The results will only have 6 rows, because days cannot be represented by that query if they are absent:
TheDate      TransactionCount
----------   ----------------
2020-01-01   8
2020-01-03   7
2020-01-04   3
2020-01-05   1
2020-01-06   9
2020-01-08   7
Here is the plan for that query, just for reference. Note the sort operator; even though the index seek returns the EventTime column in order, the convert makes a subsequent sort necessary:

If we want all the days represented even if there were no sales, we need to find some other way to fill the gaps. This is where a date series generator can come in handy – we can pull all the dates from the date series function, then perform a left join with the transactional data.
DECLARE @Start date = '20200101', @End date = '20200108';
SELECT f.TheDate, TransactionCount = COUNT(t.KeyColumn) <br />  FROM dbo.GenerateDateSeries(@Start, @End) AS f<br />  LEFT OUTER JOIN dbo.Transactions AS t<br />    ON t.EventTime >= f.TheDate<br />   AND t.EventTime < DATEADD(DAY, 1, f.TheDate)<br />  GROUP BY f.TheDate<br />  ORDER BY f.TheDate;
Results show all 8 rows, where absent dates are represented by 0:
TheDate      TransactionCount
----------   ----------------
2020-01-01   8
2020-01-02  0
2020-01-03   7
2020-01-04   3
2020-01-05   1
2020-01-06   9
2020-01-07  0
2020-01-08   7
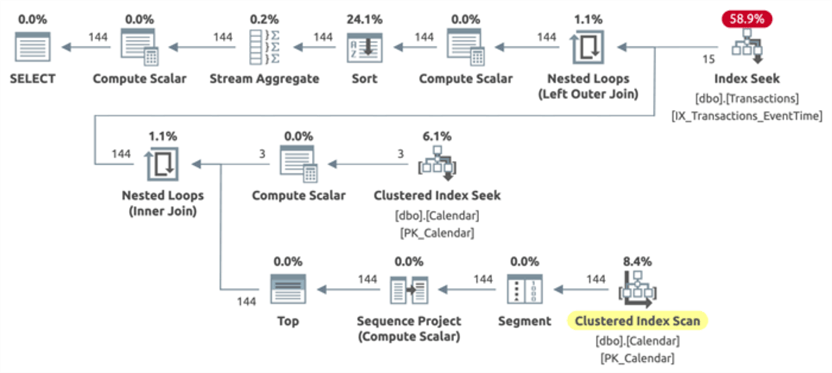
The plan here is understandably more complex and has a higher estimated subtree cost, but this is still going to be fairly efficient – and note there is no sort operator anymore:

The costs change very little for narrow or wide date ranges, but overall costs will likely vary based on size, statistics, and distribution of the transactional table data.
You can also generate more granular series using a single day or range of days, without any additional objects, making it easy to generate hourly reporting with no gaps. Let’s say, for the first day in January, we want a report that has a row for every half hour throughout the day. We can first generate 48 row numbers from the calendar table, then multiply each row number by 30 to get the next 30-minute interval.
DECLARE @minutes int = 30;
DECLARE @Start date = '20200101', @End date = '20200103';
;WITH intervals AS<br />(<br />  SELECT TOP (24*60/@minutes) rn = ROW_NUMBER() OVER (ORDER BY TheDate) <br />    FROM Calendar.dbo.Calendar<br />),<br />ranges AS <br />(<br />  SELECT TheWindow = DATEADD(MINUTE, (i.rn-1)*@minutes, CONVERT(datetime2(3), f.TheDate))<br />    FROM Calendar.dbo.GenerateDateSeries(@Start, @End) AS f<br />    CROSS JOIN intervals AS i<br />)<br />SELECT r.TheWindow, COUNT(t.KeyColumn)<br />  FROM ranges AS r<br />  LEFT OUTER JOIN SalesStuff.dbo.Transactions AS t<br />    ON t.EventTime >= r.TheWindow<br />   AND t.EventTime < DATEADD(MINUTE, @minutes, r.TheWindow)<br />  GROUP BY r.TheWindow<br />  ORDER BY r.TheWindow;
Abridged results:
TheWindow          TransactionCount
----------------   ----------------
2020-01-01 00:00   0
2020-01-01 00:30   0
2020-01-01 01:00   0
2020-01-01 01:30   0
2020-01-01 02:00   1
…
2020-01-03 21:30   0
2020-01-03 22:00   1
2020-01-03 22:30   0
2020-01-03 23:00   0
2020-01-03 23:30   0
The plan for this query looks like this (with MAXDOP 1):
While the calendar table is tiny, the scan to get the 48 rows per day is a little wasteful, so feel free to allow for parallelism or to use any technique you may already like for efficient number series generation (this set of posts from Itzik Ben-Gan is excellent).
Identifying Date Gaps and Islands
The above queries help eliminate gaps, but what if we want to highlight just the gaps or islands? Queries get a little more complex but I have used a DENSE_RANK() pattern with great success, and having a calendar table (and a function that draws from that table) helps keep the query logic manageable.
In the transaction data above, we have already identified that there are gaps, but let’s make the data a bit more sparse by deleting data from two of the days:
DELETE SalesStuff.dbo.Transactions <br /> WHERE EventTime >= '20200104'<br /> AND EventTime < '20200106';
Now we should have grouped data that looks like this (and I’m assigning a label for how I describe each set of rows as they flip between being present and not):
TheDate      TransactionCount
----------   ----------------
2020-01-01   8                  -- island #1
2020-01-02   0                  -- gap #1
2020-01-03   0                  -- gap #1
2020-01-04   0                  -- gap #1
2020-01-05   1                  -- island #2
2020-01-06   9                  -- island #2
2020-01-07   0                  -- gap #2
2020-01-08   7                  -- island #3
Now, a query I often use to return both gaps and islands together (and capable of generating exactly the previous result set) looks like the following:
DECLARE @Start date = '20200101',<br />        @End   date = '20200108';
;WITH src AS <br />(<br />  SELECT f.TheDate, TransactionCount = COUNT(t.KeyColumn)<br />    FROM Calendar.dbo.GenerateDateSeries(@Start, @End) AS f<br />    LEFT OUTER JOIN SalesStuff.dbo.Transactions AS t<br />      ON t.EventTime >= f.TheDate<br />     AND t.EventTime <  DATEADD(DAY, 1, f.TheDate)<br />    GROUP BY f.TheDate<br />),<br />gaps AS<br />(<br />  SELECT TheDate, <br />         TransactionCount, <br />         gap = DATEADD(DAY, DENSE_RANK() OVER (ORDER BY TheDate) * -1, TheDate)<br />  FROM src<br />  WHERE TransactionCount = 0<br />),<br />islands AS<br />(<br />  SELECT TheDate, <br />         TransactionCount, <br />         island = DATEADD(DAY, DENSE_RANK() OVER (ORDER BY TheDate) * -1, TheDate) <br />  FROM src WHERE TransactionCount > 0<br />),<br />rawdata(TheDate, TransactionCount, Label) AS<br />(<br />  SELECT TheDate, <br />         TransactionCount, <br />         Label = 'gap ' + RTRIM(DENSE_RANK() OVER (ORDER BY gap)) <br />  FROM gaps<br />  UNION ALL<br />  SELECT TheDate,<br />         TransactionCount, <br />         Label = 'island ' + RTRIM(DENSE_RANK() OVER (ORDER BY island))<br />  FROM islands<br />)<br />SELECT TheDate,<br />       Label,<br />       TransactionCount<br />FROM rawdata <br />ORDER BY TheDate;
This returns the following result:
TheDate      Label      TransactionCount
----------   --------   ----------------
2020-01-01   island 1   8
2020-01-02   gap 1      0
2020-01-03   gap 1      0
2020-01-04   gap 1      0
2020-01-05   island 2   1
2020-01-06   island 2   9
2020-01-07   gap 2      0
2020-01-08   island 3   7
If I want to just identify the gaps, I can take my grouped query from before, and then apply DENSE_RANK() to the result:
DECLARE @Start date = '20200101',<br />        @End   date = '20200108';
;WITH src AS <br />(<br />  SELECT f.TheDate, TransactionCount = COUNT(t.KeyColumn)<br />    FROM Calendar.dbo.GenerateDateSeries(@Start, @End) AS f<br />    LEFT OUTER JOIN SalesStuff.dbo.Transactions AS t<br />      ON t.EventTime >= f.TheDate<br />     AND t.EventTime <  DATEADD(DAY, 1, f.TheDate)<br />    GROUP BY f.TheDate<br />),<br />gaps AS<br />(<br />  SELECT TheDate, <br />         gap = DATEADD(DAY, DENSE_RANK() OVER (ORDER BY TheDate) * -1, TheDate)<br />  FROM src<br />  WHERE TransactionCount = 0<br />)<br />SELECT TheDate, <br />       [Gap #] = DENSE_RANK() OVER (ORDER BY gap) <br />  FROM gaps<br />  ORDER BY TheDate;
Results:
TheDate      Gap #
----------   -----
2020-01-02   1
2020-01-03   1
2020-01-04   1
2020-01-07   2
Similarly, if I want to identify the islands, I can just flip the where clause in the second CTE:
DECLARE @Start date = '20200101',<br />        @End   date = '20200108';
;WITH src AS <br />(<br />  SELECT f.TheDate, TransactionCount = COUNT(t.KeyColumn)<br />    FROM Calendar.dbo.GenerateDateSeries(@Start, @End) AS f<br />    LEFT OUTER JOIN SalesStuff.dbo.Transactions AS t<br />      ON t.EventTime >= f.TheDate<br />     AND t.EventTime <  DATEADD(DAY, 1, f.TheDate)<br />    GROUP BY f.TheDate<br />),<br />islands AS<br />(<br />  SELECT TheDate, <br />         island = DATEADD(DAY, DENSE_RANK() OVER (ORDER BY TheDate) * -1, TheDate)<br />  FROM src<br />  WHERE TransactionCount > 0<br />)<br />SELECT TheDate, <br />       [Island #] = DENSE_RANK() OVER (ORDER BY island) <br />  FROM islands<br />  ORDER BY TheDate;
Results:
TheDate      Island #
----------   --------
2020-01-01   1
2020-01-05   2
2020-01-06   2
2020-01-08   3
If I want to group the gaps and islands together, showing each set on a row, and even highlight streaks and transaction counts across each streak, I can further group as follows:
DECLARE @Start date = '20200101',<br />        @End   date = '20200108';
;WITH src AS <br />(<br />  SELECT f.TheDate, TransactionCount = COUNT(t.KeyColumn)<br />    FROM Calendar.dbo.GenerateDateSeries(@Start, @End) AS f<br />    LEFT OUTER JOIN SalesStuff.dbo.Transactions AS t<br />      ON t.EventTime >= f.TheDate<br />     AND t.EventTime <  DATEADD(DAY, 1, f.TheDate)<br />    GROUP BY f.TheDate<br />),<br />gaps AS<br />(<br />  SELECT TheDate, <br />         TransactionCount, <br />         gap = DATEADD(DAY, DENSE_RANK() OVER (ORDER BY TheDate) * -1, TheDate)<br />  FROM src<br />  WHERE TransactionCount = 0<br />),<br />islands AS<br />(<br />  SELECT TheDate, <br />         TransactionCount, <br />         island = DATEADD(DAY, DENSE_RANK() OVER (ORDER BY TheDate) * -1, TheDate) <br />  FROM src WHERE TransactionCount > 0<br />),<br />rawdata(TheDate, TransactionCount, Label) AS<br />(<br />  SELECT TheDate, <br />         TransactionCount, <br />         Label = 'gap ' + RTRIM(DENSE_RANK() OVER (ORDER BY gap)) <br />  FROM gaps<br />  UNION ALL<br />  SELECT TheDate,<br />         TransactionCount, <br />         Label = 'island ' + RTRIM(DENSE_RANK() OVER (ORDER BY island))<br />  FROM islands<br />)<br />SELECT WindowStart      = MIN(TheDate), <br />       WindowEnd        = MAX(TheDate), <br />       TransactionCount = SUM(TransactionCount), <br />       DayStreak        = COUNT(*)<br />FROM rawdata <br />GROUP BY label<br />ORDER BY WindowStart;
Results:
WindowStart   WindowEnd    TransactionCount   DayStreak
-----------   ----------   ----------------   ---------
2020-01-01    2020-01-01   8                  1
2020-01-02    2020-01-04   0                  3
2020-01-05    2020-01-06   10                 2
2020-01-07    2020-01-07   0                  1
2020-01-08    2020-01-08   7                  1
You can include the label in the output if it provides a better visual cue than TransactionCount alone.
Of course there are likely many more exotic gaps and islands problems you may need to solve, and there are a lot of great treatments of the subject, including right here on this site.
Conclusion
In the first two parts in this series, I have shown several examples where a calendar table can help solve, or at least simplify, common business problems surrounding dates. In the next part I will demonstrate how to use a calendar table to configure and optimize schedules, forecast conflicts, and deal with other complex scheduling requirements.
Next Steps
For more info on calendar tables and general date handling in SQL Server, see these tips and videos:
- Using a calendar table in SQL Server – Part 1
- Creating a date dimension or calendar table in SQL Server
- SQL Server DateTime Best Practices
- Recommended SQL Server Date Formats
- SQL Server Date Time Shorthand and Other Tricks
- SQL Server Date and Time Data Type Comparison
- SQL Server Window Functions Gaps and Islands Problem
- All SQL Server date tips

Aaron Bertrand (@AaronBertrand) is a passionate technologist with industry experience dating back to Classic ASP and SQL Server 6.5. He also blogs at sqlblog.org.
- MSSQLTips Awards: Author of the Year – 2016, 2023 | Leadership (200+ tips) – 2022


