Problem
Machine Learning (ML) is a way of teaching computers to learn from data instead of being explicitly programmed. Performance metrics are essential tools for understanding how well a model actually works. They tell you not just how accurate the model is, but how reliable, fair, and useful it will be in real-world applications. In other words, without them, machine learning would be a trial-and-error guesswork.
Binary classification is when each sample is labeled as one of two mutually exclusive classes, referenced to a categorization, like positive or negative.
How do you implement the binary classification performance metric in SQL Server without using external tools?
Solution
Let’s start off with creating a table and insert some values. I will use this data to explain the meaning of the terms or definitions used in this article.
User-defined function Fβ score
-- ==================================================
-- Author:      SCP - MSSQLTips
-- Create date: 20251128
-- Description: F_beta performance score
-- ==================================================
CREATE OR ALTER FUNCTION    [dbo].[ufnScoreFBeta]
                (@beta float
                ,@p float
                ,@r float)
RETURNS float
WITH EXECUTE AS CALLER
AS
BEGIN
    DECLARE @Result float
            ,@beta2 float = SQUARE(@beta);

    SET @Result = (1 + @beta2) * @p * @r / (@beta2 * @p + @r);

    RETURN @Result;
END
GO
Table-value function Binary performance metrics
-- =============================================
-- Author:      SCP - MSSQLTips
-- Create date: 20251129
-- Description: ML Binary performance metrics
-- =============================================
CREATE OR ALTER FUNCTION     [dbo].[tvfMLBinPerfMetrics]
                (@Tp float
                ,@Tn float
                ,@Fp float
                ,@Fn float
                ,@n float)
RETURNS             @Result
    TABLE        (Accuracy float
                ,F1 float
                ,PrecisionVal float
                ,Recall float
                ,Specificity float
                ,MCC float
                ,KL_Divergence float)
WITH EXECUTE AS CALLER
AS
BEGIN

    INSERT INTO  @Result
        SELECT   (@Tp + @Tn) / (@Tp + @Fp + @Tn + @Fn) AS [Accuracy]
                ,(2 * @Tp) / (2 * @Tp + @Fp + @Fn) AS [F1]
                ,@Tp / (@Tp + @Fp) AS [Precision]
                ,@Tp / (@Tp + @Fn) AS [Recall]
                ,@Tn / (@Tn + @Fp) AS [Specificity]
                ,(@Tn * @Tp - @Fn * @Fp) /
                    SQRT((@Tp + @Fp) * (@Tp + @Fn) * (@Tn + @Fp) * (@Tn + @Fn)) AS [MCC]
                ,((@Tp + @Fn) * LOG((@Tp + @Fn) / (@Tp + @Fp)) + (@Tn + @Fp) *
                                LOG((@Tn + @Fp) / (@Tn + @Fn))) / @n AS [KL_Divergence];
    RETURN;
END
GO
Patient Table
I will use a Healthcare example to show how the binary classification model is trying to predict whether a patient has Pneumonia or not.
The Machine Learning details will not be provided because this tip is about measuring performance. I wrote another article about Machine Learning in this Neural Network in SQL Server article.
The binary classification will be based on the following metrics:
- Symptoms: Fever (°C) and cough severity scale (0 for none to 3 for severe)
- Lab results: CRP (C-reactive protein) where high suggests inflammation, and WBC (white blood cells) count where high suggests infection
- Demographics: age (years)
- Diagnostics: verified presence of Pneumonia
- Predict label (calculated column): if the ML predict value is >= 0.5 then true, otherwise false
-- MSSQLTips (T-SQL)
CREATE TABLE [dbo].[PatientMLBin](
[PatientId] [int] NOT NULL,
[Age] [int] NULL,
[Fever] [float] NULL,
[CoughSeverity] [int] NULL,
[WBC] [float] NULL,
[CRP] [int] NULL,
[IsDiseasePresent] [bit] NULL,
[Predicted] [float] NULL,
[PredictedLabel] AS (case when [predicted]>=(0.5) then (1) else (0) end),
CONSTRAINT [PK_PatientMLBin] PRIMARY KEY CLUSTERED
(
[PatientId] ASC
)WITH (PAD_INDEX = OFF, STATISTICS_NORECOMPUTE = OFF, IGNORE_DUP_KEY = OFF, ALLOW_ROW_LOCKS = ON, ALLOW_PAGE_LOCKS = ON, OPTIMIZE_FOR_SEQUENTIAL_KEY = OFF) ON [PRIMARY]
) ON [PRIMARY]
GO
-- entering some data
INSERT INTO [dbo].[PatientMLBin]
([PatientId]
,[Age]
,[Fever]
,[CoughSeverity]
,[WBC]
,[CRP]
,[IsDiseasePresent]
,[Predicted])
VALUES ( 1,67,39.1,3,17.8,122,1,0.91)
,( 2,25,37.2,1, 5.4, 3,0,0.12)
,( 3,54,38.5,2,14.2, 95,1,0.76)
,( 4,71,38.9,3,16.5,110,1,0.62)
,( 5,33,37.0,1, 6.1, 4,0,0.33)
,( 6,48,37.6,1, 7.2, 8,0,0.44)
,( 7,59,39.0,3,18.1,140,1,0.81)
,( 8,42,38.1,2,10.5, 25,0,0.55)
,( 9,63,38.4,2,13.8, 80,1,0.59)
,(10,29,37.3,1, 6.3, 5,0,0.18);
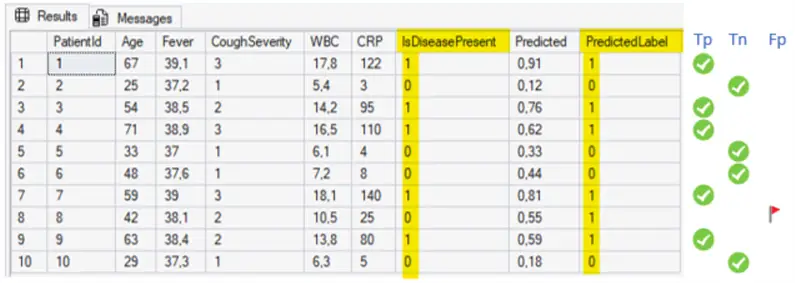
SELECT [PatientId]
,[Age]
,[Fever]
,[CoughSeverity]
,[WBC]
,[CRP]
,[IsDiseasePresent]
,[Predicted]
,[PredictedLabel]
FROM [MsSqlTips].[dbo].[PatientMLBin];
GOResulting in
Terms and definitions
Metrics
- True positive (Tp): is the number of data samples correctly identified as positive.
- True negative (Tn): is the number of data samples correctly identified as negative.
- False positive (Fp) or Type I error: is the number of data samples incorrectly identified as positive.
- False negative (Fn) or Type II error: is the number of data samples incorrectly identified as negative.
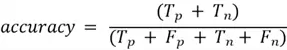
Accuracy
Accuracy is the ratio of correct predictions to all predictions and is calculated as:
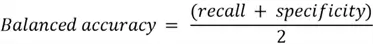
Balanced Accuracy
Balanced Accuracy is the average of recall and specificity, giving equal importance to how well the model finds positive and identifies negatives. This is to avoid bias that impact accuracy toward the majority class.
Balanced Accuracy calculation:
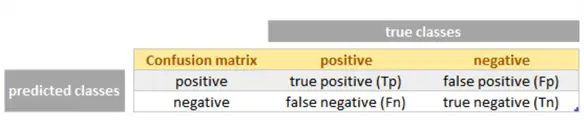
Confusion Matrix
A Confusion Matrix is a method of displaying the number of true and predicted classifications for each class, where it has true classes in columns and predicted classes in rows. While confusion matrices are used to generate several widely applicable classification functional correctness metrics, they can also be used to calculate metrics for specialized applications.
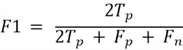
F1 Score
The F1 Score is the harmonic mean of precision and recall with equal weights.
F1 Score is calculated as:
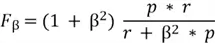
Fβ score
Fβ score is a version of F1 Score that lets you choose whether precision or recall matters more. If missing positives is not desirable, like in disease detection where it is better to avoid missing sick patients, we make recall more important (β > 1). But if false alarms are not desirable, like in fraud alerts where is better to avoid false alarms, we make precision more important (β < 1).
Using p as precision value and r as recall value, the score is calculated as:
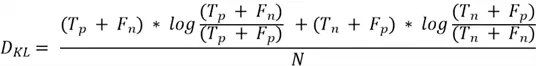
Kullback-Leibler (KL) Divergence
Kullback-Leibler (KL) Divergence measures how different distribution is from another. It compares the true frequency of each label in the dataset versus the predicted frequency of each label. In summary, how far your model´s predicted label proportions are from the real ones.
Using N as number of samples, it is calculated as:
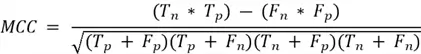
Matthews’s Correlation Coefficient (MCC)
The Matthews’s Correlation Coefficient summarizes the results from confusion matrices in a single value where 1 is the perfect classification, zero is a random classification, and -1 the complete disagreement between predicted and actual classification.
Matthews’s Correlation Coefficient is calculated as:
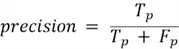
Precision
Precision represents how many of the items you predicted as positive were actually correct, where high precision indicates few false alarms, and low precision has many false alarms. It does not check for how many true positives were missed.
Precision is calculated as:
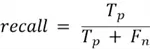
Recall or Sensitivity
Recall represents how many of the actual positives the model successfully found. High recall indicates the model misses few positives, and low recall indicates the model misses many positives.
Recall is calculated as:
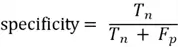
Specificity
Specificity represents how many of the actual negatives the model successfully found. This is where high specificity indicates few false alarms, and low specificity in the model indicates many false alarms.
Specificity is calculated as:
Calculating the Values
-- MSSQLTips (T-SQL)

DECLARE      @Tp float
            ,@Tn float
            ,@Fp float
            ,@Fn float
            ,@p float
            ,@r float
            ,@n float;

SELECT       @Tp = SUM(CASE WHEN [IsDiseasePresent] = 1 AND [IsDiseasePresent] = [PredictedLabel] THEN 1 ELSE 0 END)
            ,@Fn = SUM(CASE WHEN [IsDiseasePresent] = 1 AND [IsDiseasePresent] <> [PredictedLabel] THEN 1 ELSE 0 END)
            ,@Fp = SUM(CASE WHEN [IsDiseasePresent] = 0 AND [IsDiseasePresent] <> [PredictedLabel] THEN 1 ELSE 0 END)
            ,@Tn = SUM(CASE WHEN [IsDiseasePresent] = 0 AND [IsDiseasePresent] = [PredictedLabel] THEN 1 ELSE 0 END)
            ,@n = COUNT(*)
    FROM     [dbo].[PatientMLBin];

SELECT       @n n,@Tn Tn,@Fp Fp,@Fn Fn,@Tp Tp;

DECLARE      @ConfusionMtx
    TABLE   (Confusion_Matrix  nvarchar(50)
            ,Pneumonia nvarchar(50)
            ,No_pneumonia nvarchar(50));

INSERT INTO  @ConfusionMtx
    VALUES   ('Pneumonia',@Tp,@Fp)
            ,('No pneumonia',@Fn,@Tn);

SELECT * FROM @ConfusionMtx;

SELECT * FROM [dbo].[tvfMLBinPerfMetrics] (@Tp,@Tn,@Fp,@Fn,@n);

        --You must specify how much more important recall is than precision:
        --      β = 0.5  → precision-oriented
        --      β = 1    → balanced (F1)
        --      β = 2    → recall-oriented
        --      β = any positive real number

SELECT       @r = @Tp / (@Tp + @Fn)
            ,@p = @Tp / (@Tp + @Fp);

SELECT       [dbo].[ufnScoreFBeta] (0.5,@p,@r) AS F0_5
            ,[dbo].[ufnScoreFBeta] (1.0,@p,@r) AS F1
            ,[dbo].[ufnScoreFBeta] (2.0,@p,@r) AS F2;
GO
Resulting in

Understanding the results
- Accuracy is how often the model is right. An accuracy of 0.9 suggests the model correctly identifies 9 out 10 patients. However, accuracy can hide problems when classes are imbalanced, like many more health patients. In our case where the recall of 1 is perfect, and specificity of 0.8 means that accuracy reflects a well-balanced performance.
- F1 Score as balance of precision and recall, of 0.9091 means that the model does well detecting pneumonia cases (recall) avoiding too many false alarms (precision).
- Precision is how often a pneumonia prediction is correct. Precision of 0.8333 means that of all the patients as 83.3% actually had pneumonia, where occasionally false alarms still happen, but not often.
- Recall or sensitivity, is how well pneumonia cases are detected. Recall of 1 indicates that the model correctly detects 100% of actual pneumonia cases, once we do not have false negatives. This is excellent for patient safety, because missing pneumonia can lead to severe complications.
- Specificity is how well healthy patients are left alone. Specificity of 0.8 means that of all patients who were actually healthy, 80% were correctly predicted as healthy, but 20% of healthy ones are incorrectly flagged as pneumonia.
- MCC is the overall reliability. An MCC of 0.8165 means that the model performs reliably.
- KL Divergence is the prediction of disease prevalence. A KL Divergence of 0.02041 is near to zero which means that the model matches the real disease prevalence well, not distorting the expected pneumonia rate.
- Fβ score of 0.8621 is given more weight than precision. This is used when being wrong about a positive case is costly. This shows that the model still performs well when precision is emphasized.
- Fβ score of 0.9091 gives equal importance to precision and recall, showing that the model is overall well-balanced.
- Fβ score of 0.9615 given more weight to recall, it is used when missing a positive case is dangerous and shows that the model scores extremely well.
Summarizing the results for our model:
- As a screening test, it is excellent as it detects all pneumonia cases
- As a diagnostic test it is good, but not sufficient alone because some healthy patients are incorrectly flagged.
Next Steps

Sebastião Pereira has over 40 years of experience in database development including T-SQL, algorithm design, machine learning and bringing innovative mathematical formulas to SQL Server. He started his career at a transnational fast-moving consumer goods (FMCG) company as an employee then later transitioning into a consultant role. He eventually founded his own company to develop software solutions for the healthcare industry. Sebastião is a respected award-winning author on MSSQLTips.com extending SQL Server capabilities beyond traditional workloads.
- MSSQLTips Awards
- Author of the Year – 2025
- Trendsetter (25+ tips) – 2025
- Rookie of the Year – 2024


Hi Sebastião
About Kullback-Leibler (KL) Divergence, discrete entropy should be computed with Log base 2.
Try this.
— =============================================
— Author:
— Create date:
— Description:
— =============================================
CREATE FUNCTION [dbo].[KLD](@TP int, @FP int, @FN int, @TN int)
RETURNS float
AS
BEGIN
DECLARE @Q float = 0, @P float = 0, @N float = @TP + @FP + @FN + @TN
IF ((@TP + @FN) > 0)
SET @P += (@TP + @FN) / @N * LOG((@TP + @FN) / @N, 2)
IF ((@TN + @FP) > 0)
SET @P += (@TN + @FP) / @N * LOG((@TN + @FP) / @N, 2)
IF (@TP > 0)
SET @Q += @TP / @N * LOG(@TP / @N, 2)
IF (@FP > 0)
SET @Q += @FP / @N * LOG(@FP / @N, 2)
IF (@FN > 0)
SET @Q += @FN / @N * LOG(@FN / @N, 2)
IF (@TN > 0)
SET @Q += @TN / @N * LOG(@TN / @N, 2)
RETURN -@Q + @P — -Q – -P
END