Problem
So far I see you’ve covered persisting SQL Server performance counter values obtained from sys.dm_os_performance_counters and querying the results for buffer pool information. What about the other aspect of SQL Server memory: plan cache?
Solution
If you’ve been following this tip series you’ve seen how to collect SQL Server performance counters from within Transact-SQL via querying sys.dm_os_performance_counters without ever needing to launch Performance Monitor. You’ve also been exposed to how you can persist this information to a physical table for historical querying. In the last tip I also provided you with queries you can run to return historical information about a range of metrics associated with the Buffer Pool. Now I want to turn your attention to the Plan Cache and what information we can look at coming from our counter repository as is associated with that aspect of SQL memory.
The Plan cache is the component of SQL memory that stores query plans for re-use. When a query is issued against SQL, the optimizer will attempt to re-use a cached plan if the traits of the query permit – but can only do so if that plan resides in cache, otherwise it needs to compile a new plan. This is not to say that every plan that is cached is re-used. Changes in schema, a query running parallel that may have run serially before, or changes in parameters may require a new plan to be compiled even if a similar plan exists in cache. Plan compilations are expensive though – if plans are flushed from cache only to be recompiled afterwards because of size constraints it is doubly-so.
Plan Cache counters we are tracking in this multi-tip exercise are presented below:

Plan Cache Queries
The following queries cover two areas of interest when it comes to Plan Cache: Cache Hit Ratio – the percentage of plans that are satisfied from the Plan Cache versus being compiled as new or recompiled due to changes in schema or some other reason and Plan Cache size. Just as in the previous tip in this series we will look at this in two different manners: as a detail query returning individual records for each data collection period, and as an aggregate for a supplied time range. For the sake of this article I am using a one hour timeframe for all detail queries and a 24-hour timeframe for all aggregate queries.
Plan Cache hit ratio measure the percentage of plans that are satisfied from the Plan Cache. It requires two counters for computation: Plan Cache / Cache Hit Ratio (which is the number of plans that were satisfied by the Plan Cache) and Cache Hit Ratio Base (which measure the total amount of plans that have been requested). Dividing the former by the later gives us the ratio of success. The closer this number is to 100% the better.
-->Plan Cache Detail<-----------------------------------------
DECLARE @start DATETIME, @end DATETIME
SELECT @start = DATEADD(hh,-1,GETDATE())
SELECT @end = GETDATE()
SELECT Hits.[instance_name],
CAST((Hits.[cntr_value] * 1.0 / Total.[cntr_value]) * 100.0 AS DECIMAL(5,2)) AS [plan_cache_hit_ratio],
[Pages].[cntr_value] AS [cache_pages],
([Pages].[cntr_value] * 8 / 1024) AS [cache_in_mb],
Hits.[date_stamp]
FROM
(
SELECT [instance_name], [cntr_value], [date_stamp]
FROM iDBA.[MetaBOT].[dm_os_performance_counters]
WHERE [counter_name] = 'Cache Hit Ratio'
AND [date_stamp] BETWEEN @start AND @end
) Hits
INNER JOIN
(
SELECT [instance_name], [cntr_value], [date_stamp]
FROM iDBA.[MetaBOT].[dm_os_performance_counters]
WHERE [counter_name] = 'Cache Hit Ratio Base'
AND [date_stamp] BETWEEN @start AND @end
) Total
ON Hits.[date_stamp] = Total.[date_stamp]
AND [Hits].[instance_name] = [Total].[instance_name]
INNER JOIN
(
SELECT [instance_name], [cntr_value], [date_stamp]
FROM iDBA.[MetaBOT].[dm_os_performance_counters]
WHERE [object_name] LIKE '%:Plan Cache%'
AND [counter_name] = 'Cache Pages'
AND [date_stamp] BETWEEN @start AND @end
) Pages
ON Hits.[date_stamp] = [Pages].[date_stamp]
AND Hits.[instance_name] = [Pages].[instance_name]
ORDER BY Hits.[date_stamp] DESC, Hits.[instance_name];

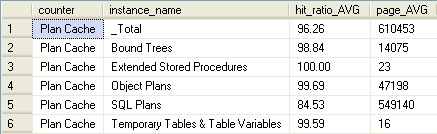
Looking at the results you’ll see that the Plan Cache counter values are divided into 6 “instances”: Bound Trees, Extended Stored Procedures, Object Plans, SQL Plans, Temporary Tables & Table Variables, and _Total. Each are described below: Thank you Jonathan Kehayias (twitter) for helping me flesh these descriptions out better than I originally did in my first draft!
- Bound Trees – associated with objects that are schema-bound such as views, user tables, check constraints, and computed columns
- Extended Stored Procedures – plans associated with system and extended stored procedures
- Object Plans – plans that are generated through the creation of programmability objects within the databases on an instance, such as stored procedures, user-defined functions, and triggers
- SQL Plans – compiled SQL plans; both ad-hoc and prepared
- Temporary Tables & Table Variables – are just that, plans associated with temporary table and table variables
- _Total – completely self-explanatory; the sum of all-of-the-above
We can also aggregate these results similarly to how we did in our previous tip when examining Buffer Pool:
-->Plan Cache Summary<-----------------------------------------
DECLARE @start DATETIME, @end DATETIME
SELECT @start = DATEADD(hh,-24,GETDATE())
SELECT @end = GETDATE()
SELECT
'Plan Cache' AS [counter],
Hits.[instance_name],
CAST(MIN((Hits.[cntr_value] * 1.0 / Total.[cntr_value]) * 100.0) AS DECIMAL(5,2)) AS [hit_ratio_MIN],
MIN(Pages.[cntr_value]) AS [page_MIN],
(MIN(Pages.[cntr_value]) * 8/1024) AS [mb_MIN],
CAST(AVG((Hits.[cntr_value] * 1.0 / Total.[cntr_value]) * 100.0) AS DECIMAL(5,2)) AS [hit_ratio_AVG],
AVG(Pages.[cntr_value]) AS [page_AVG],
(AVG(Pages.[cntr_value]) * 8/1024) AS [mb_AVG],
CAST(MAX((Hits.[cntr_value] * 1.0 / Total.[cntr_value]) * 100.0) AS DECIMAL(5,2)) AS [hit_ratio_MAX],
MAX(Pages.[cntr_value]) AS [page_MAX],
(MAX(Pages.[cntr_value]) * 8/1024) AS [mb_MAX]
FROM
(
SELECT [instance_name], [cntr_value], [date_stamp], [counter_name]
FROM iDBA.[MetaBOT].[dm_os_performance_counters]
WHERE [counter_name] = 'Cache Hit Ratio'
AND [date_stamp] BETWEEN @start AND @end
) Hits
INNER JOIN
(
SELECT [instance_name], [cntr_value], [date_stamp]
FROM iDBA.[MetaBOT].[dm_os_performance_counters]
WHERE [counter_name] = 'Cache Hit Ratio Base'
AND [date_stamp] BETWEEN @start AND @end
) Total
ON Hits.[date_stamp] = Total.[date_stamp]
AND [Hits].[instance_name] = [Total].[instance_name]
INNER JOIN
(
SELECT [instance_name], [cntr_value], [date_stamp]
FROM iDBA.[MetaBOT].[dm_os_performance_counters]
WHERE [object_name] LIKE '%:Plan Cache%'
AND [counter_name] = 'Cache Pages'
AND [date_stamp] BETWEEN @start AND @end
) Pages
ON Hits.[date_stamp] = [Pages].[date_stamp]
AND Hits.[instance_name] = [Pages].[instance_name]
GROUP BY Hits.[counter_name], Hits.[instance_name];


In my next tip in this continuing series on persisted performance counters we will look at the how to add counters to our watched counter list across all SQL instances in your network.
Next Steps
- More information on Buffer Pool and Plan Cache is available from my good friend Denny Cherry here.
- Other articles associated with Buffer Pool and Plan Cache are also available on MSSQLTips.com.
- Other tips in this series are forthcoming. Tips still to come in this series include coverage of activity-related counters, CPU, and physical file-related queries and how this information can be utilized in consolidation planning.
- Previous tips in this series are available here:
- Additional tips on Retaining Historical Index Usage Stats from the Dynamic Management Views are available

Tim Ford is a Senior Database Administrator with MindBody in San Luis Obispo, California and is in the process of relocating west to the Pacific Northwest from Michigan. Since 2010 he’s produced Microsoft Data Platform training events branded as SQL Cruise from Alaska to the Caribbean and the Mediterranean at Tech Outbound, an events company specializing in technical training in unconventional locations. His SQL Cruise events take place on cruise ships in the Caribbean, Alaska, and the Mediterranean. Tim also is the Executive VP of Marketing for PASS, the global association for Microsoft data professionals. He also is a contributing author for itprotoday. Tim loves helping people find their true potential through education and building networks between Thought Leaders in various fields and those who are just starting on their careers or struggling to find their footing in established careers. If you’re looking for this sort of experience then check out the next SQL Cruise event taking place this August in Seattle.
- MSSQLTips Awards: Acheiver (75+ tips) – 2010