By: Brady Upton | Comments (8) | Related: > Extended Events
Problem
We've all heard about Extended Events and how they can help troubleshoot SQL Server performance, connectivity, and locking problems, but they seem so difficult to implement using T-SQL. Isn't there a better way to implement SQL Server Extended Events?
Solution
SQL Server 2012 introduces a GUI in SQL Server Management Studio to create and manage extended events. Prior to the SQL Server 2012 integration, Extended Events could only be created using T-SQL. In this tip, I'll show you step by step process on how to create a simple Extended Event in SQL Server 2012 using the new GUI in SQL Server Management Studio.
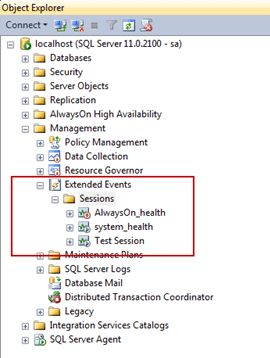
Creating an Extended Event has never been easier with SQL Server 2012. Open SSMS, and drilldown to Management, Extended Events, Sessions as shown in the image below. By default, you should see an AlwaysOn_health and a system_health session already created. You will notice the AlwaysOn_health session is disabled and the system_health session is running. The system_health session collects system data that you can use to help troubleshoot performance issues. For the most part, SQL Server Extended Events use very little resources.
There are two ways to create a session. Right click on the Sessions folder and you can choose New Session or New Session Wizard. In this tip, we'll step through using the wizard.
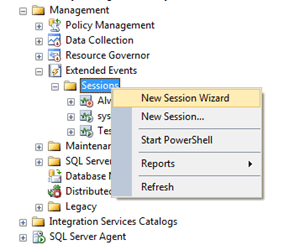
After clicking New Session Wizard, an Introduction window will appear that will give you a brief introduction. Click the "Next" button to continue.
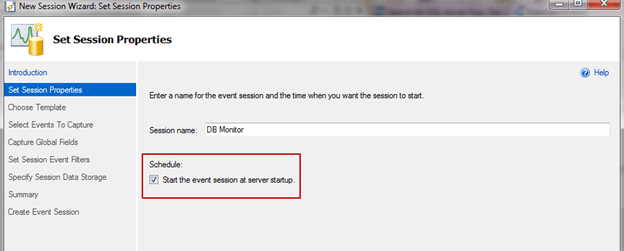
The next window, Set Session Properties, is where you can specify the session name and whether or not you want the session to start on server startup. In this tip, I'll name the session DB Monitor and choose to start the event session at server startup. Click the "Next" button to continue.
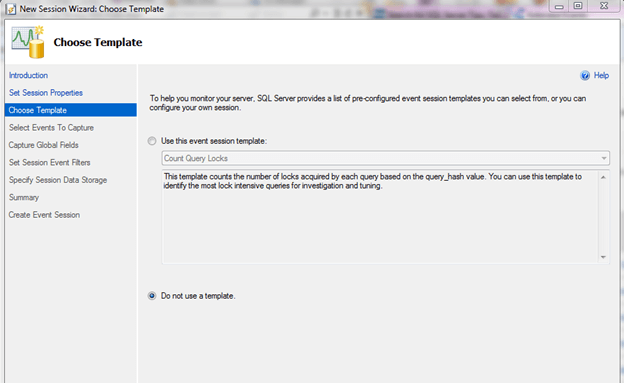
The next screen will allow us to choose a preconfigured template or create our own. If you've ever used SQL Server Profiler's built in template, these function the same way. In this tip, we'll create our own. Choose the "Do not use a template" option and click the "Next" button to continue.
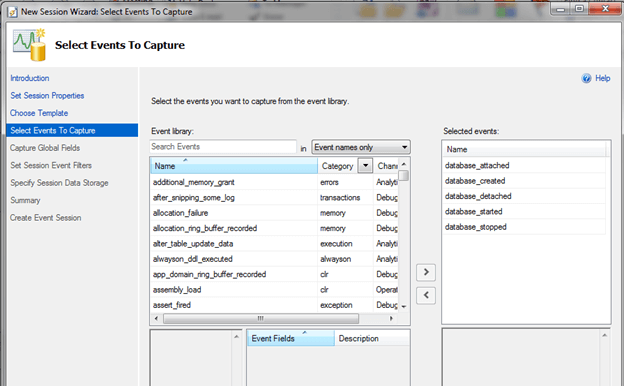
The "Select Events To Capture" window is an important one. This is where we select the events we want to capture. For this example, I want to monitor when my DB goes offline and when it becomes available, so I'll choose the events that relate to this: database_attached, database_created, database_detached, database_started, and database_stopped. Once you select the events from the "Event library" (on the left), click the right arrow to move them to the "Selected events" (on the right). Click the "Next" button to continue.
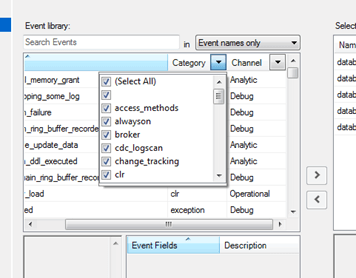
*** Note *** - You can also filter category or channels to narrow down the choices as shown below.
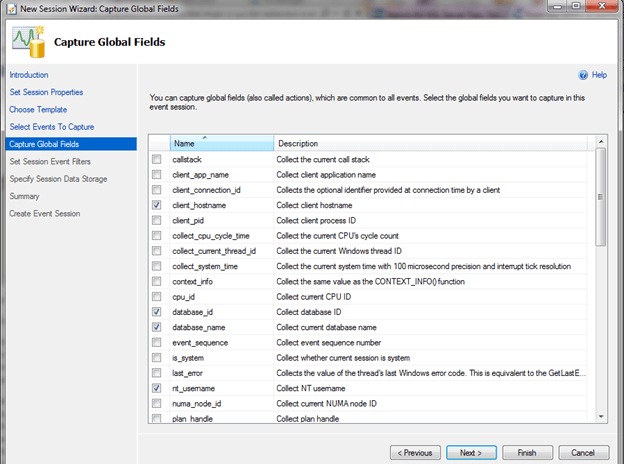
The next window that appears is the "Capture Global Fields" window and this is also important because this window allows you to select the actions you want to capture for each event. For example, if a database was detached you would want to know which database it was so choosing the database_id action would be appropriate. In this example, I'll just choose a few actions to get us started: client_hostname, database_id, database_name, nt_username, server_instance_name, server_principal_name, and sql_text. Click the "Next" button to continue.
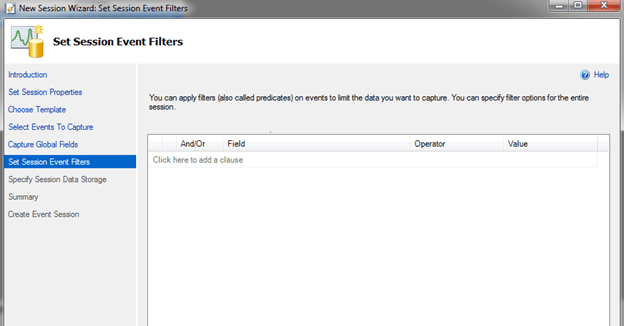
The next window is where you can apply filters on the events to limit data. For this tip, I'll leave this window blank. Click the "Next" button to continue.
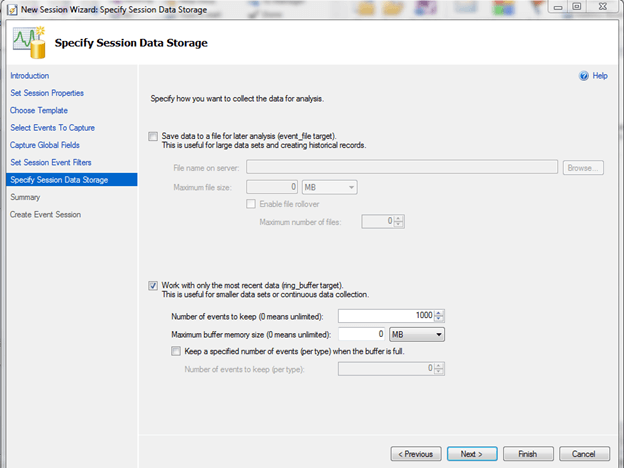
Specify Session Data Storage is where you can specify how you want to collect the data for analysis. You can either save the data to a file or work with the most recent data and specify the number of events you want to keep. For this tip, I'll choose "Work with only the most recent data" and keep the default of 1000 events. Click the "Next" button to continue.
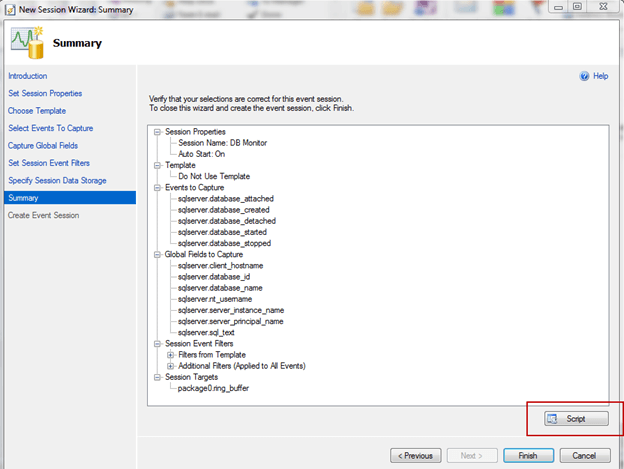
The last window displays a Summary of the information selected in the previous windows. There is also a script button that allows you to script out the T-SQL for the event. Click Finish to create the session.
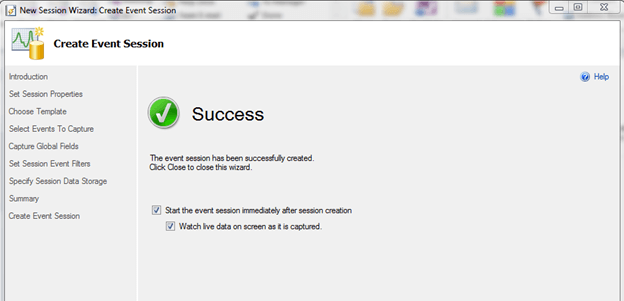
Once you click the "Finish" button you should receive a "Success" window where you can start the event session immediately and watch live data as it's captured. I'll go ahead and select both of these. Click the "Close" button to complete the process.
Back in SSMS, you should see the Live Data window:
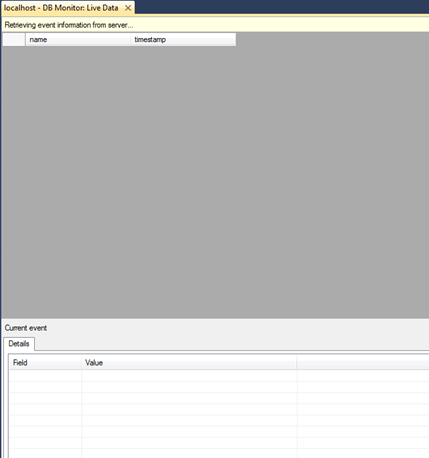
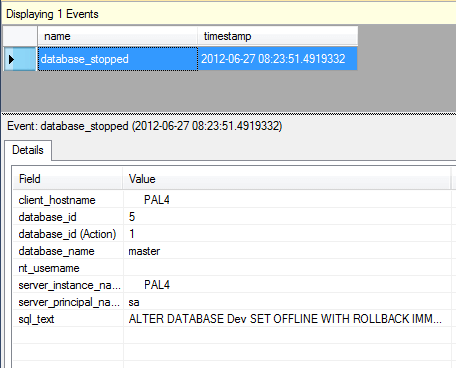
The window should be blank now, but if we try to take a database offline we'll see some activity in this window. First I'll run the following query to take the database Dev offline:
ALTER DATABASE Dev SET OFFLINE WITH ROLLBACK IMMEDIATE
Once the database goes offline, you can see the event captured along with the details we selected in the Live Data monitor:
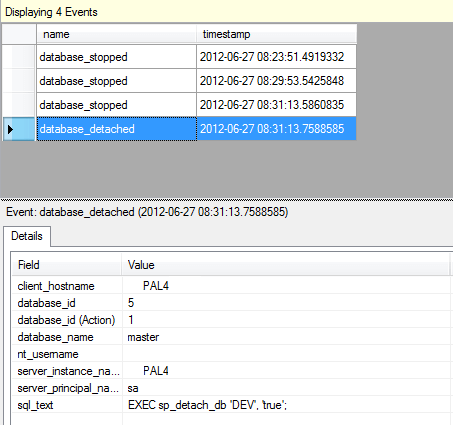
Next I will bring the database online and detach it and view the results in the Live Data Monitor:
ALTER DATABASE Dev SET ONLINE WITH ROLLBACK IMMEDIATE
GO
EXEC sp_detach_db 'DEV', 'true'
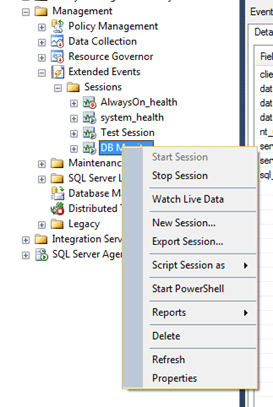
Of course, you're not going to be always sitting at your laptop staring at the Live Data monitor so it's ok to close this window and when you need to view events just right click on the session and choose Watch Live Data. You can also stop the session, script the session, and view the properties from this menu.
As you can see, the new Extended Events GUI makes it much easier to create and manage different Extended Events and these can be really helpful in troubleshooting SQL Server operational and performance issues.
Next Steps
- To learn more about SQL Server 2012 and Extended Events check out this MSDN blog
- To view all of MSSQLTips Extended Events information click here
About the author
 Brady Upton is a Database Administrator and SharePoint superstar in Nashville, TN.
This author pledges the content of this article is based on professional experience and not AI generated.
View all my tips


