By: Arshad Ali | Comments (4) | Related: > Analysis Services Tutorials
Problem
In my last tip, "Getting started with Tabular Model in SQL Server 2012 - Part 1" I talked in detail about differences between the multi-dimensional and tabular models, when to choose one model or another and I demonstrated step by step on how to create a basic tabular model project. But if you have prior experience working with PowerPivot, you might be thinking whatever we did, in the last tip, is very similar to what we can do in PowerPivot. Well, you are right to some extent, the Tabular model is actually a server side version of PowerPivot, but also has many more enterprise features, which are not available in PowerPivot for example partitioning, security, management, etc. In this tip I am going to talk in detail about some of the compelling features of the tabular model and show you how tabular models differ from PowerPivot.
Solution
SQL Server 2008 R2 introduced VertiPaq (xVelocity) engine for storing data in highly compressed format in memory structure at runtime and makes the performance of analysis significantly faster in Excel with PowerPivot. Further, PowerPivot could be deployed to SharePoint for collaboration and to convert personal BI options to the team BI solutions. SQL Server 2012 has brought version 2 of VertiPaq (xVelocity) engine with several new enhancements and features; but the best part of this version is, it also works server side providing enterprise scale in-memory BI capabilities.
With SQL Server 2012, both PowerPivot and the Tabular model is based on VertiPaq (xVelocity) version 2 engine and hence they both share many new features of the engine as listed below:
- DAX - DAX (Data Analysis Expression) is an expression language based on Excel formulas that was introduced initially with PowerPivot and is built on tabular concepts (tables, columns, and relationships). DAX can be used to support model development (like creating calculated columns, measures, and KPIs for tabular models and PowerPivot models), relationship navigation, context modification, and time intelligence. The latest version of the VertiPaq (xVelocity) engine has several new enhancements.
- Measure grid view or Diagram view of the model
- Improved date and text filtering and several other usability enhancements
- Hierarchies
- KPIs or Key Performance Indicators
- Perspectives
- Distinct count
- Drill-through
- Defining a table as Date Table
- Multiple relationships - Not natively supported currently, but can be implemented with a workaround
- Parent Child relationship - Not natively supported currently, but can be implemented with a workaround
- Descriptions
- Persisted formatting
- Advance sorting
- Reporting properties enhancements
The Tabular model is based on a server side version of the VertiPaq (XVelocity) engine, which can be leveraged as an enterprise BI Platform. Tabular model also provides several enterprise level features, which are not available in PowerPivot; some of them are discussed below:
- Security, row level security - In the case of PowerPivot, only file level security is available whereas in case of Tabular model security can be defined at a row level.
- Table Partition for huge tables for better scalability and performance.
- Pass-through mode - DirectQuery to directly pull data from data sources each time query runs along with cached mode. In PowerPivot only in-memory/cached mode is available.
- Better Management - Using SSMS (SQL Server Management Studio) for backup and restore, adding and managing partitions, adding and managing security roles, processing databases, tables or partitions, restoring from PowerPivot workbook, etc.
- Programmatic support - AMO/AMOMDNET/PowerShell.
- Scalability - Not limited to 2 GB file size as is the case with PowerPivot.
Creating Calculate Columns or Calculated Measures in the SQL Server Analysis Services Tabular Model
Calculated members are like named calculations in Analysis Services multi-dimensional cube whereas Calculated measures are like calculated measures of Analysis Services multi-dimensional cube. We use DAX to create calculated columns or calculated measures. To create a calculated column, go to the end of the column view in the Measure grid of the model and add a calculated measure. Alternatively you can right click on the column header followed by clicking on the "Insert a Column" menu item and specify your new calculated column. In order to create calculated measures, you need to click in the measure group grid section and add a calculated measure.
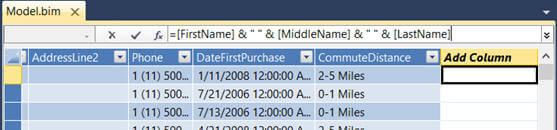
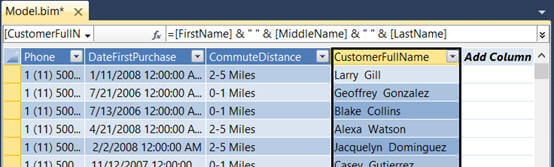
In the image above, I have added a calculated member (CustomerFullName) which combines data from other three columns of the table.
Calculated columns are calculated after data has been loaded (cube processing) and evaluated in row context whereas Calculated measures are calculated on the fly and evaluated in the filter context (rows/columns/filters/slicers).
Hiding columns or tables from client tool with the SSAS Tabular Model
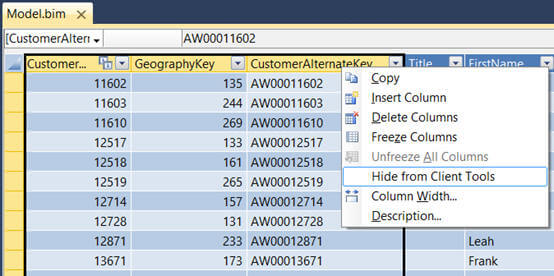
There are might be several columns in tables or even a table itself which you would like to hide from appearing it in client tool. In order to do so, you need to go to either grid view or diagram view then select the columns or table you want to hide, by right clicking on this and then click on "Hide from Client tools" menu item as shown below.
Please note, hiding a column or a table is not a means for restricting access to them, the items just will not appear in the client tool. A person having required access can still access them using DAX even if it does not appear in client tool. To restrict access you need to create a security role and assign appropriate permissions as well as members to it. We will explain more on this later in this tip.
Creating Hierarchies in the Tabular Model
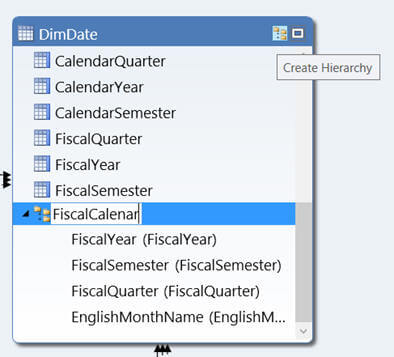
Hierarchies - an ordered appearance of the columns in the reporting client field lists, makes it easier for users to use the hierarchy in a report. Hierarchies can provide a simple, intuitive view of an otherwise complex data structure. They are metadata that define relationships between two or more columns in a table and are very similar to hierarchies in Analysis Services multi-dimensional model. Hierarchies appear separate from other columns (normally we hide the columns which we include in a hierarchy) in a reporting client field list, making them easier for client users to navigate and include in a report. In order to create a hierarchy, go to the diagram view then click on the tiny "Create Hierarchy" icon appearing on the top right side of each table (or right click and click on Create Hierarchy menu item) and then drag the columns in the order you want in the newly created hierarchy as per your requirement as shown below:
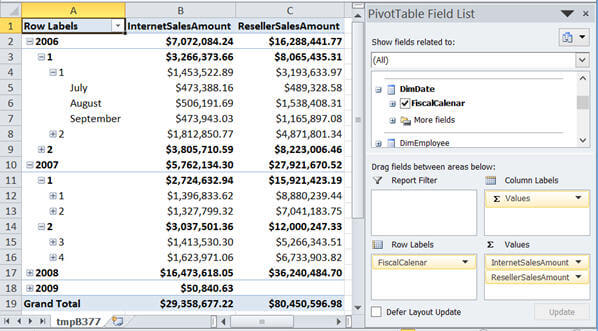
Once you are done with creating hierarchies, you will notice them appearing in client tools and you can then use them for your reporting needs as shown below:
Defining or Marking a table as a Date with the SSAS Tabular Model
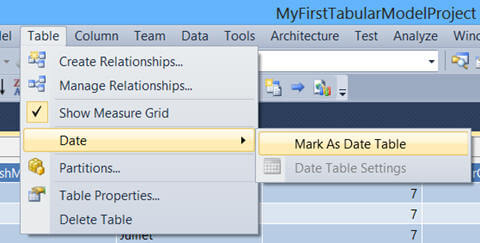
Often we do analysis based on date or over time i.e. total sales based on year to date. In order to enable such analysis, we need to define or mark a table, in the tabular model, as date table and then specify a column from that table as date column. To mark a table as Date Table, go to Table menu, click on Date -> Mark as Date Table as shown below:
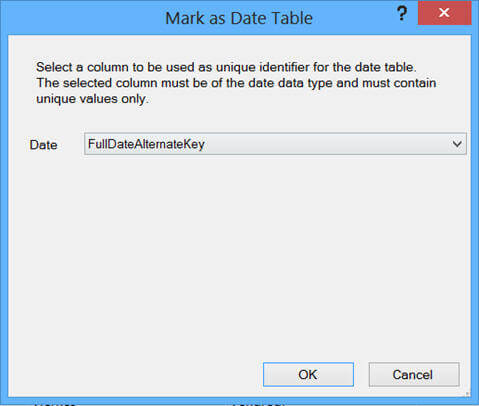
Clicking on above menu item will bring up a dialog box where you need to specify the date column from the selected table as shown below, the selected column must have unique values for the date data type:
Creating Key Performance Indicators or KPIs in the Tabular Model
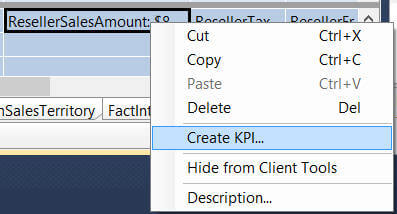
A Key Performance Indicator or KPI, in the tabular model, is used to gauge the business performance against a set target. Each KPI will have a base value or a measure as well as a target value (which will come either from another measure or absolute value can be specified). In order, to create a KPI, you need to use the measure grid view for a table to select a measure that evaluates to the KPI's base value. Right click on this measure and then click on Create KPI menu item as shown below:
On the Key Performance Indicator (KPI) dialog box you need to next specify the target value (which could be value of another measure group or absolute value), define the threshold (that measure the performance between the base and target measures) for indicating red/yellow/green by using the sliders and then choose the icon type which will appear in client tool while analyzing the KPI. Check out the image below as a point of reference.
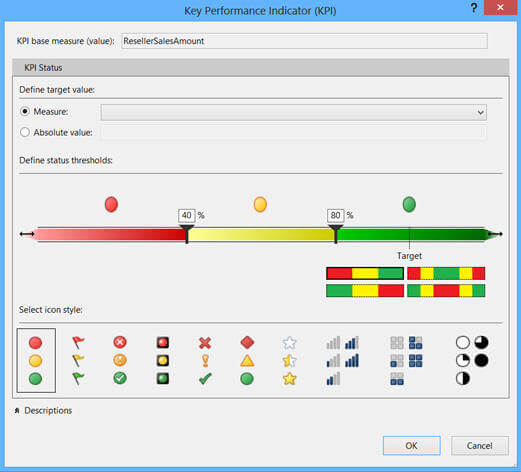
To learn more about KPI in tabular model click here.
Creating Perspectives in the SSAS Tabular Model
Perspective allows for the creation of different views of the model to provide focused, business-specific, or application-specific viewpoints of the model. For example, you might have one model for the enterprise, but you would like to create a view for the marketing team which will show only tables related to or needed by marketing team. Likewise you would like to create another view for finance team, which will show only tables related to or needed by finance team, etc. These different views are what are called perspectives, which the tabular model allows us to create. If you have experience working with SSAS in past, this perspective is similar to the perspective which we used to create in a multi-dimensional cube. In order to create a perspective in the tabular model, click on Perspective icon in the toolbar when model is opened; click on New Perspective in the Perspective dialog box, specify a name for the perspective and include whatever tables/columns you want to include in this perspective or view as shown below:
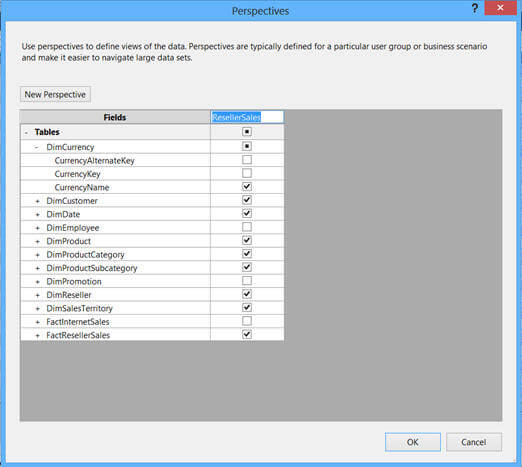
Please note, perspective is not a means to restrict the access to the model, it is used to provide different views of the complex model based on a focus group or business area. A person having appropriate permissions can still access the tables/columns using DAX even if it is not included in the perspective. To restrict access, you need to create a security role and assign the appropriate permissions and members to it. To learn more about Perspective in the tabular model click here.
Creating Security Roles in the Tabular Model
Unlike PowerPivot where you can provide permission only at file level, in the tabular model you have more fine grained control in providing access to your model. You can create a security role for defining member permissions for a model. Each role that we create can be assigned as "None", "Read", "Read and Process", "Process" and "Administrator" permissions. Further it can have additional security at the row-level by using row-level filters. In order to create a security role, click on Roles icon in the toolbar and specify permissions and members for your role as shown below:
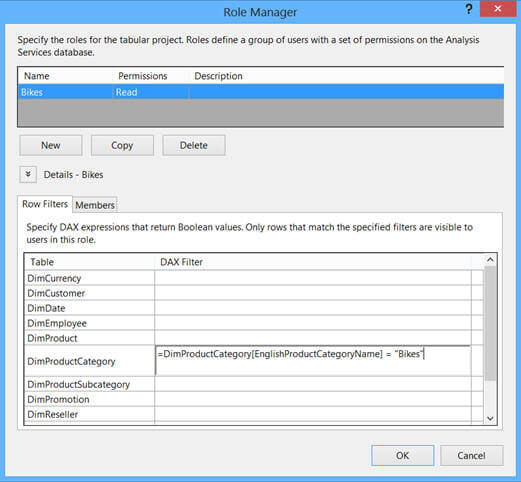
As you can see in the above image, I have created a role to have all the tables granted read access, but restricted the rows to have only products which belong to "Bikes" product category. While designing the model in the SQL Server Data Tool, when you click on "Analyze in Excel" icon it will prompt you to specify the security role or perspective you want to analyze under, as shown below:
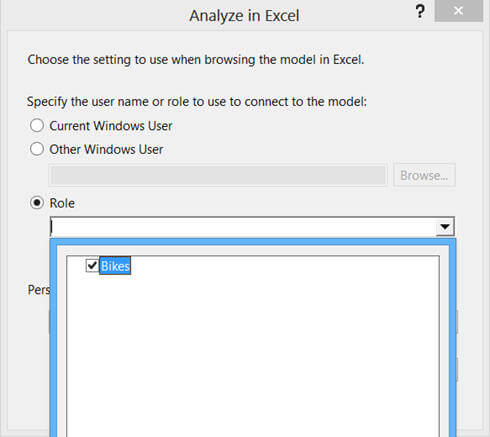
To learn more about security roles in tabular model click here.
Creating Table Partitions in the SQL Server Analysis Services Tabular Model
Partitioning is one of the scalability solutions which divides a large table into several logical parts called partitions. Further, each partition can be processed independent of the other partitions of the same table. This actually improves the performance of the model processing by only processing partitions from the current period and not all partitions. On the other hand, at the same time it improves the performance of the query by using a technique called partition elimination. In order to create a partition for a table, click on Partitions icon in the tool bar to bring up Partition Manager as shown below:
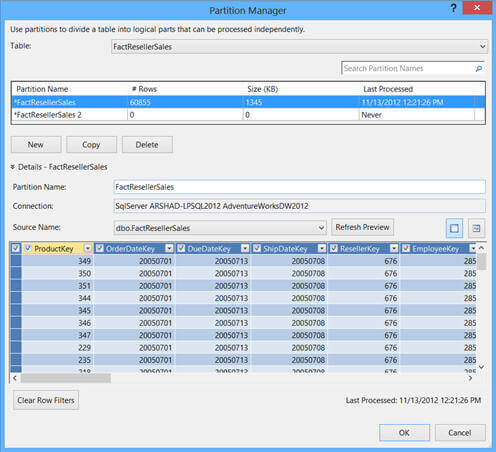
On the Partition Manager dialog box, first of all you need to select the table to be partitioned at the top then click on "New" button to create another partition of the table. You can click on "Copy" button to create a partition by copying it from the existing partition. You can specify the conditions for rows to fall in a particular partition either using Table Preview or Query Editor modes. To learn more about table partition in tabular model click here.
Next Steps
- Review Understanding BI Semantic Model (BISM) of SQL Server 2012
- Review Getting started with Tabular Model in SQL Server 2012 - Part 1
- Review a href="http://blogs.technet.com/b/dataplatforminsider/archive/2010/11/12/analysis-services-roadmap-for-sql-server-denali-and-beyond.aspx" target="_blank"> Analysis Services - Roadmap for SQL Server Code Name "Denali" and Beyond.
- Review Comparing Tabular and Multidimensional Solutions (SSAS).


About the author
 Arshad Ali is a SQL and BI Developer focusing on Data Warehousing projects for Microsoft.
This author pledges the content of this article is based on professional experience and not AI generated.
View all my tips
