By: Norman Chan | Comments (12) | Related: > SQL Server Management Studio
Problem
I've downloaded and installed Performance Dashboard reports for SQL Server 2005 from Microsoft's download site, but I can't find Performance Dashboard for SQL Server 2008? How can I use this for SQL Server 2008 and 2008R2?
Solution
Unfortunately Microsoft does not provide Performance Dashboard for SQL Server 2008 for download, but there is a work-around by installing Performance Dashboard for SQL Server 2005 and modifying the provided Performance Dashboard T-SQL setup script from Microsoft. We will walk through the steps below.
Overview
Performance Dashboard is a set of (SQL Server Reporting Services) SSRS reports that are loaded into our SQL Server Management Studio (SSMS) built using Dynamic Management Views (DMVs) intended to help quickly identify potential performance problems within SQL Server. This allows the DBA to view reports for CPU and IO bottlenecks through several pre-written reports in areas such as top CPU, duration, logical reads, physical reads, logical writes, CLR time, waits, missing indexes and IO information. This tool is convenient for DBAs to quickly see information about key SQL Server performance statistics in one "dashboard" (place). DMVs are not obsolete with this tool, if more research is required we can dig deeper querying specific DMVs, but by using the Performance Dashboard it provides an excellent starting point. Although it is a great tool, keep in mind these reports come from DMVs, which are not static and only show the current status of SQL Server, therefore once SQL Server is restarted the historical statistics from DMVs are lost.
This package is provided for download by Microsoft. It's comprised of two key components Performance Dashboard custom reports that will be installed on the client machine for use with SSMS and a T-SQL setup script with custom stored procedures utilized by the Performance Dashboard reports. The reports are stored locally on our SSMS client after installation. In order for reports to work it requires executing the T-SQL setup script on each SQL Server we wish to use with Performance Dashboard reports to install the custom stored procedures.
Download
First download Performance Dashboard reports for SQL Server 2005 from Microsoft. http://www.microsoft.com/en-us/download/details.aspx?id=22602
Installation
Install Performance Dashboard on our workstation accepting the default locations, or you can choose a different installation location:
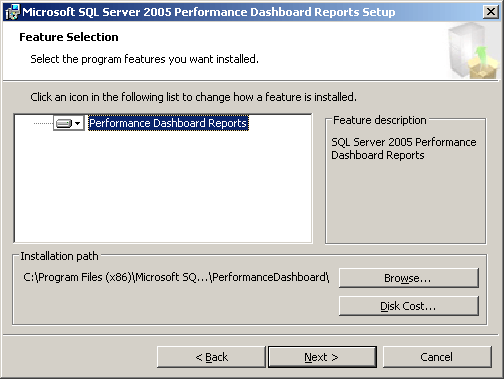
By default it is installed in: C:\Program Files (x86)\Microsoft SQL Server\90\Tools\PerformanceDashboard
Note: If the default directory changes, you will need to remember to change the path appropriately for the following steps outlined in this tip.
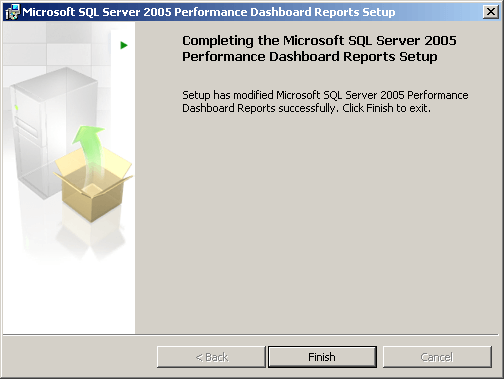
A successful installation message will be displayed when complete:
Post Installation Setup
Post-Installation has two parts:
- Executing a modified version of Microsoft's custom T-SQL script (setup.sql)
- Setting up Performance Dashboard in SQL Server Management Studio (SSMS)
The first part requires executing Microsoft's "setup.sql" script on the SQL Server we wish to use the Performance Dashboard. This can be found in C:\Program Files (x86)\Microsoft SQL Server\90\Tools\PerformanceDashboard where it was installed.
- Connect to the SQL Server we would like to utilize SQL Server Performance Dashboard. (e.g. MYSQLSERVER )
- Open a New Query Window in SSMS for that SQL Server.
- Open file setup.sql located: C:\Program Files (x86)\Microsoft SQL Server\90\Tools\PerformanceDashboard
- Use the Find feature (CTRL-F) look for keyword: select @ts_now = cpu_ticks
- The find feature will help us locate where to change setup.sql from the old code:
select @ts_now = cpu_ticks / convert(float, cpu_ticks_in_ms) from sys.dm_os_sys_info
to the new code:
select @ts_now = ms_ticks from sys.dm_os_sys_info
- After the code change, we should be able to successfully execute the setup.sql script.
If we try to run the original setup.sql on a SQL Server 2008 or 2008 R2 server before making the changes above, we get this error:
Msg 207, Level 16, State 1, Procedure usp_Main_GetCPUHistory, Line 6 Invalid column name 'cpu_ticks_in_ms'.
This is due to a change in the sys.dm_os_sys_info view, which removes "cpu_ticks_in_ms" in versions of SQL Server 2008 and newer. (note: If we have a SQL Server 2012 instance and attempt to install the available SQL 2012 Performance Dashboard download, that particular stored procedure has also been fixed in the same manner using "ms_ticks" instead of calculating with "cpu_ticks_in_ms")
The second part of post-installation requires setting up SQL Server Performance Dashboard for the first time by providing SSMS the location of our Performance Dashboard reports.
- We should be connected to the SQL Server we ran setup.sql on earlier (e.g. MYTESTSQLSERVER)
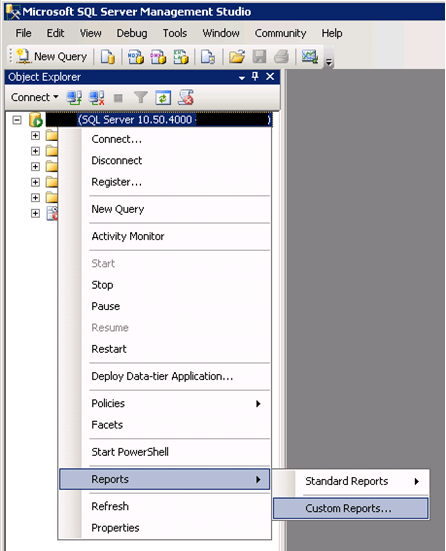
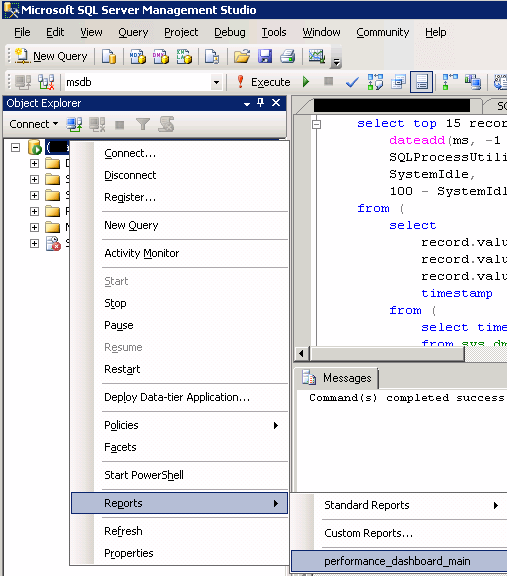
- Right-Click the SQL Server, navigate to the server level reports section, select Custom Reports.
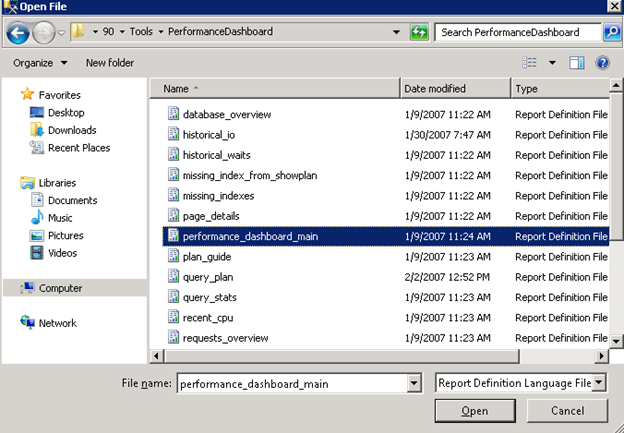
- A pop-up window will appear, navigate to Performance Dashboard's installation directory: C:\Program Files (x86)\Microsoft SQL Server\90\Tools\PerformanceDashboard
If you have chosen a different file path during installation, you will need to use that file path to find your Performance Dashboard folder.
Select "performance_dashboard_main" and click open.
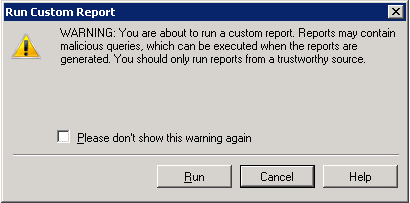
- Accept by clicking Run.
- You've now successfully setup Performance Dashboard custom Reports that are compatible with SQL Server 2008 and 2008 R2.
Sample Performance Dashboard
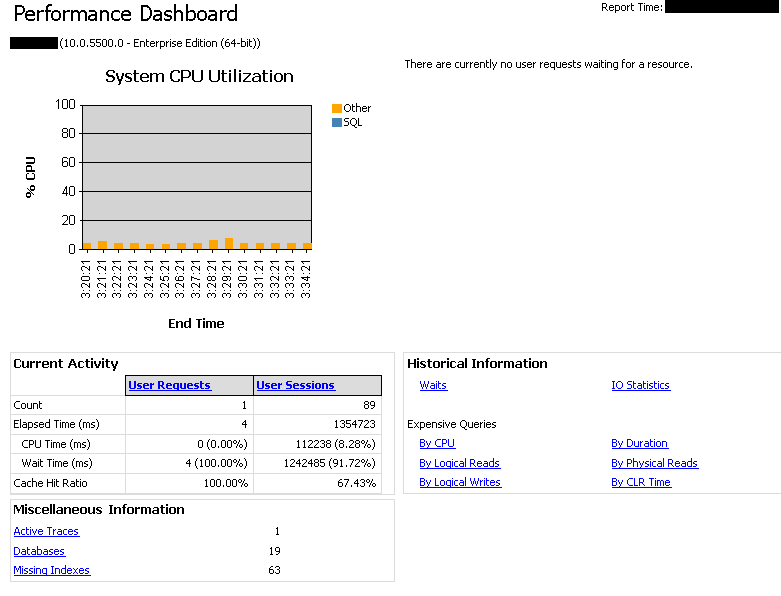
Viewing the Dashboard
Next time we would like to view the Performance Dashboard, we navigate to server level reports and open "performance_dashboard_main" for our SQL Server.
Conclusion
By configuring the Performance Dashboard for SQL Server 2005 to be used for SQL Server 2008 we can utilize this free tool from Microsoft to aid in trouble-shooting database performance issues. Although it may become unsupported, so far due to its popularity it has been available directly from Microsoft or via work-arounds for all versions of SQL Server beginning with SQL Server 2005 and newer. The most recent version available is for SQL Server 2012.
Next Steps
- Run the setup.sql Performance Dashboard script on all of your SQL Server 2008 and 2008R2 Servers to save time in troubleshooting issues: http://www.mssqltips.com/sql-server-tip-category/140/central-management-servers/
- Learn more about Dynamic Management Views: http://www.mssqltips.com/sql-server-tip-category/31/dynamic-management-views-and-functions


About the author
 Norman Chan is a SQL Server DBA with over 12 years of IT experience as a software developer and DBA.
This author pledges the content of this article is based on professional experience and not AI generated.
View all my tips
