By: Thomas LeBlanc | Comments (9) | Related: > Replication
Problem
Have you ever heard this question? The database refresh has gone from 10-15 minutes to 1.5 hours. Nothing has changed on the application server and the consultant said ask the DBAs to check the database server. Where do you start to find the problem? Check out this tip to learn more.
Solution
Diagnosing any performance problem in SQL Server can take many paths. Luckily, this is a new system and I have a current production system to compare performance metrics - a baseline. My first inclination was to point the finger at the consultant. But, I know there are some things to check to make sure it is not a SQL Server problem.
Performance Dashboard
Microsoft created one of my favorite Instance overview tools - Performance Dashboard.
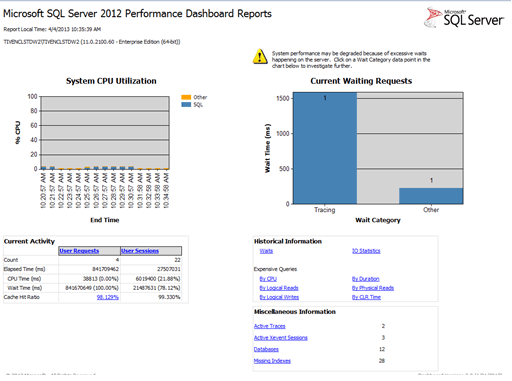
The first area I decided check was the IO Statistics because there is a new SAN on this system and I wanted to eliminate that as a problem. The Performance Dashboard has a link to a report for IO Statistics in the Historical Information quadrant (Lower-Right). After clicking on the link, we get a report.
Historical IO Report
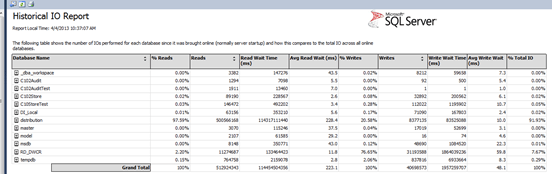
This report will show you are summary of IO on all database files including the log file. Each database is listed with summary statistics for the whole database and an expandable list will show you details of each file associated with the database and the associated detailed IO statistics. Note: These numbers are from the last restart of the instance. Once an instance is restarted, the IO statistics are reset to 0.
This view shows that Replication is activated on this instance because there is a Distribution database. It has high levels of Reads and Read Wait Time (ms). We can also see the other heavily used database is the Data Warehouse staging database that sends data (CDC) to the Data Marts on another instance by a 3rd party tool.
The Avg Read Wait (ms) is 228.4 ms which is extremely high compared to the current production system and this is on a new SAN. At this point, I want to blame it on the SAN, but I decide to start a conversation with a Project Manager on that team to talk about the why replication is being used. We were initially told replication was not used in the new setup, so we did not plan this on the SQL Server side.
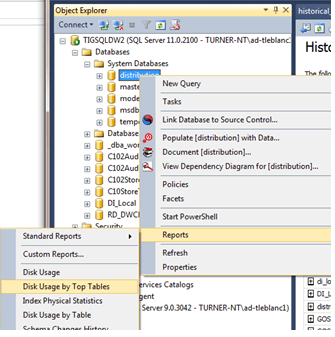
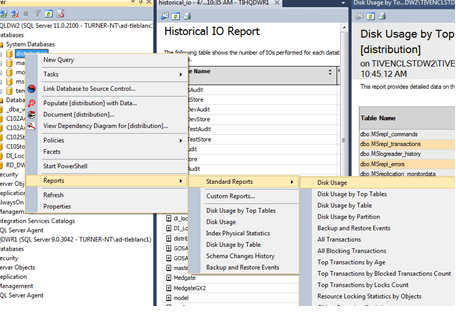
Having another person to talk and discuss the situation is very valuable. As we talked, we looked at the usage in the Distribution database. Here is where other awesome (Free) report from Microsoft came in handy - Disk Usage and Disk Usage by Top Tables reports. You access these reports by right-clicking on a database and go to the Reports/Standard Reports submenu.
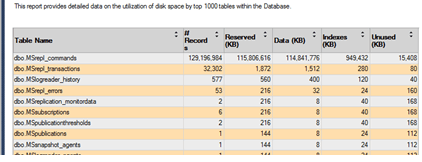
The Disk Usage by Top Table showed the MSrepl_commands table had 129+ million rows compared to 32+ thousand MSrepl_transaction rows, an indication that the DW refresh is very large and heavy on IO. The ratio of commands to transactions from the current production system was 4 to 1 compared to this which was 4000+ to 1. The other team was going to talk to the contractor about these tables because the current system has a cleanup procedure that does not seem to be working on the new system. Since the database is not being cleaned up, it is growing larger and larger.
Disk Usage
Now, to get back to the waits. We now looked at the Disk Usage report.
If this report has an area labeled "Data/Log Files Autogrow/Autoshrink Events", this means the database has been auto-growing. Expanding this metric by clicking the plus (+) sign indicated the growth rate was set to 1MB. As you see below, the growth of 1MB was taking about 20-90 ms each time and was happening about 12 times a minute. This is a majority of the Waits that was accumulated on the IO Statistics report for this database. Since the Model database is used to create a new database, the distribution database got the 1 MB growth from the model database when replication was activated.
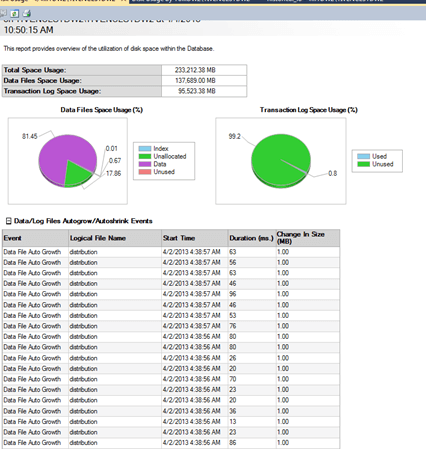
So, what is the solution to this part of the problem? We need to change the growth rate of the Data File in the Primary Filegroup to a larger number and/or increase the database to the estimated size for a full refresh. The database has now grown to a good starting refresh size, so we will change the growth rate to 1GB. Our LUN for this file is large enough to grow by this rate without a problem.
Script
USE [master]
GO
ALTER DATABASE [distribution] MODIFY FILE ( NAME = N'distribution', FILEGROWTH = 1048576KB )
GO
Now, the database is sized for refreshes and a large growth rate will help with the IO waits for processing. Next, we need to get a new refresh running and look at the next performance improvement. The contract also fixed their part by activating the cleanup routine for the distribution database.
Next Steps
- Update Model Database to Average Growth Rate for New Databases
- Work with contractors on managing the Distribution Database
- More information on Replication Distribution Database
- Check out all of the replication tips.
About the author
 Thomas LeBlanc is a Sr DBA and MCITP 05/08 DBA & 08 BI has spoken at the PASS Summit 2011/12, SQL Rally & many SQL Saturday’s.
This author pledges the content of this article is based on professional experience and not AI generated.
View all my tips


