SQL Server Reporting Services Tips and Tricks to Improve the End User Experience

By:   |   Comments (28)   |   Related: > Reporting Services Formatting


Problem

In this tip, we will look at a few SQL Server Reporting Services (SSRS) Tips and Tricks to improve the end-user experience.

Solution

Let's take a look at the following Tips and Tricks:

  • Display Total Number of Pages while Navigating
  • Display Everything in a Single Page
  • Display Report Parameter Selection
  • Display No Rows Error Message
  • Page Settings for Optimal Printing

Note: This tip assumes you have experience in building simple to medium complexity SSRS Reports.

For the purpose of this demonstration, let's build a simple report.

Create a new project, add a new report, and create a data source pointing to AdventureWorksDW database. Then create a dataset with the following query.

Report Main Dataset - "dstSSRSTipsPart2"

SELECT
    DPC.EnglishProductCategoryName AS Category
    , DPS.EnglishProductSubcategoryName AS Subcategory
    , DP.EnglishProductName AS Product
    , FIS.OrderDate
    , FIS.SalesAmount
    , FIS.Freight AS FreightAmount
    , FIS.TaxAmt AS TaxAmount
FROM
    dbo.FactInternetSales AS FIS
    INNER JOIN dbo.DimProduct AS DP
        ON FIS.ProductKey = DP.ProductKey
    INNER JOIN dbo.DimProductSubcategory AS DPS
        ON DP.ProductSubcategoryKey = DPS.ProductSubcategoryKey
    INNER JOIN dbo.DimProductCategory AS DPC
        ON DPS.ProductCategoryKey = DPC.ProductCategoryKey
    INNER JOIN dbo.DimDate AS DD
        ON FIS.OrderDateKey = DD.DateKey
WHERE DD.CalendarYear = 2005

Next, add a Table report item to the designer with five columns as Category, Subcategory, Product, OrderDate, and SalesAmount in the same sequence. The completed report, with some basic formatting, should look as shown below.

Total Pages showing as ? in navigation bar

Display Total Number of Pages while Navigating a SSRS Report

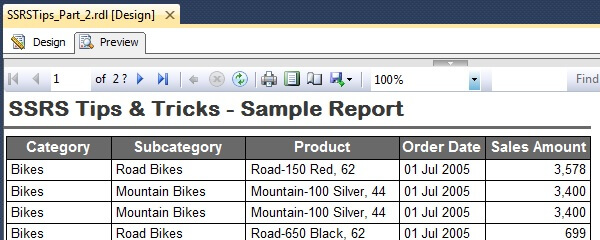
With the release of SQL Server 2008, many new features were introduced in SSRS. One of those features was "On-Demand" report processing, which is a very nice performance improvement especially for large reports. With this feature, when the report is viewed in Report Manager, SSRS displays estimated number of pages with a question mark ("?") at the end, to indicate that there are more pages to be displayed, as shown below.

Total Pages showing as ? in navigation bar

Often times users mistake this to be a bug, but this is actually the result of a feature. And hence, there are requests to display the total number of pages and remove the question mark. Let's see how we can achieve this.

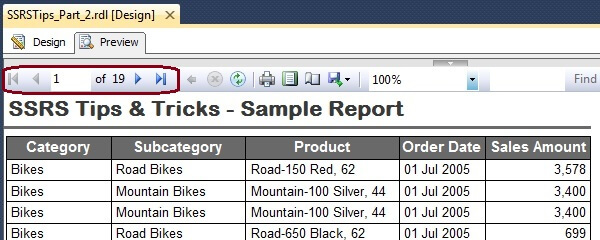
To address this issue, we need to use the "TotalPages" Built-in Field either in the report header or footer. Add a textbox either in the header or footer with the following expression and hide the textbox, so that it's not visible to the users.

=Globals!TotalPages

This will fix the issue and the total number of pages are displayed in the navigation bar and the question mark ("?") disappears as shown below.

Total Pages showing correctly in navigation bar

Display Everything in a Single Page for a SSRS Report

In certain scenarios, especially in cases like dashboards, users want all the contents to be displayed in a single page. However, when the contents of the page are more than what can actually fit on one page, the report spans across two pages.

To display all the contents of a report in one page when the report is rendered in Report Manager, set the Interactive Height property of the report to zero as shown below.

Display everything on one page

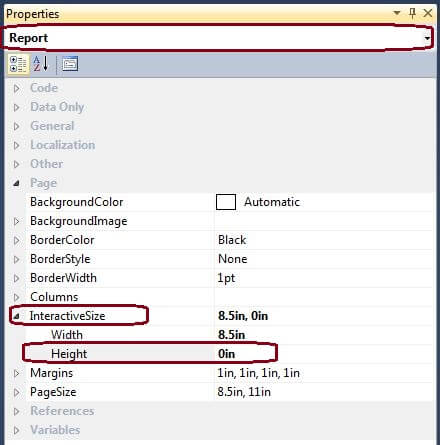
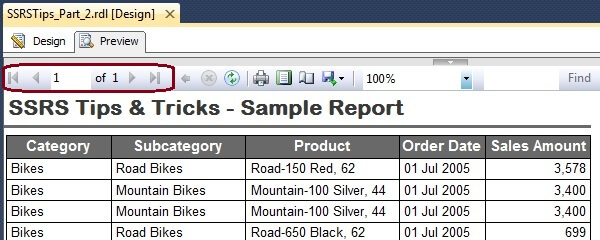
For the purpose of this demonstration, set this property for our report and notice that, all the contents are displayed in a single page as shown below. Note: Keeping all the contents on a single page for a long report can adversely impact the report rendering performance. Test, measure, and evaluate whether it's suitable for your scenario or not, before the report is released to users.

Display everything on one page

Display Report Parameter Selection for a SSRS Report

Parameters/Filters are a great way for the users to interact with the report. It is a good practice to display the parameter selection in the report as it offers various benefits including the following:

  • At a quick glance, it shows the list of values selected in each of the parameters.
  • When the report is exported and is shared with others, they get a picture of what selection of parameters resulted in the output report.

For the purpose of this demonstration, add two parameters to the report - Category & Subcategory. Configure the parameters using the below steps.

Create two datasets using the below two queries, one for each parameter. The first dataset with the first query is for the Category parameter and the second dataset with the second query is for the Subcategory parameter.

Dataset for Category Parameter - "dstCategory"

SELECT
    ProductCategoryKey AS CategoryKey
    , EnglishProductCategoryName AS CategoryName
FROM dbo.DimProductCategory

Dataset for Subcategory Parameter - "dstSubcategory"

SELECT
    ProductSubcategoryKey AS SubcategoryKey
    , EnglishProductSubcategoryName AS SubcategoryName
FROM dbo.DimProductSubcategory
ORDER BY ProductCategoryKey, EnglishProductSubcategoryName

Create and configure the two parameters using the following settings.

Parameter Property

Category Parameter

Subcategory Parameter

Name pCategory pSubcategory
Prompt Category Subcategory
Data Type Integer Integer
Selection Multi-select
(Allow Multiple Values)
Multi-select
(Allow Multiple Values)
Available Values
    Dataset dstCategory dstSubcategory
    Value Field CategoryKey SubcategoryKey
    Label Field CategoryName SubcategoryName
Default Values
    Dataset dstCategory dstSubcategory
    Value Field CategoryKey SubcategoryKey

Note that, for simplicity, we are not cascading the parameters even though these two parameters are good candidates for cascading parameters.

Next update the main report dataset "dstSSRSTipsPart2" with the following query. This is to link the above two parameters with the report's main dataset.

SELECT
    DPC.EnglishProductCategoryName AS Category
    , DPS.EnglishProductSubcategoryName AS Subcategory
    , DP.EnglishProductName AS Product
    , FIS.OrderDate
    , FIS.SalesAmount
    , FIS.Freight AS FreightAmount
    , FIS.TaxAmt AS TaxAmount
FROM
    dbo.FactInternetSales AS FIS
    INNER JOIN dbo.DimProduct AS DP
        ON FIS.ProductKey = DP.ProductKey
    INNER JOIN dbo.DimProductSubcategory AS DPS
        ON DP.ProductSubcategoryKey = DPS.ProductSubcategoryKey
    INNER JOIN dbo.DimProductCategory AS DPC
        ON DPS.ProductCategoryKey = DPC.ProductCategoryKey
    INNER JOIN dbo.DimDate AS DD
        ON FIS.OrderDateKey = DD.DateKey
WHERE 
    DD.CalendarYear = 2005
    AND DPC.ProductCategoryKey IN (@pCategory)
    AND DPS.ProductSubcategoryKey IN (@pSubcategory)

Map the Parameters in the above dataset with the corresponding Report Parameters. Parameter Mapping should look as shown below.

Parameter Mapping for Main Report Dataset

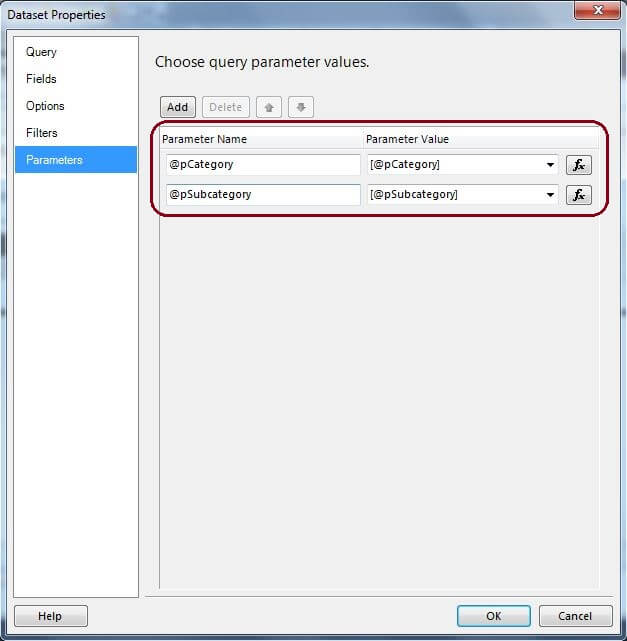
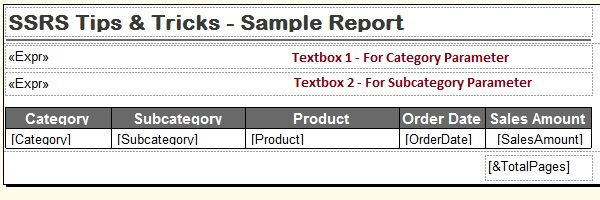
Next add two textboxes to the report above the Table with the following expressions.

Expression for 1st Textbox for Category Parameter

="Selected Categories: " & Join(Parameters!pCategory.Label, ", ")

Expression for 2nd Textbox for Subcategory Parameter

="Selected Subcategories: " & Join(Parameters!pSubcategory.Label, ", ")

Your report design surface should look as shown below.

Report designer after adding the textboxes for Category and Subcategory Parameters

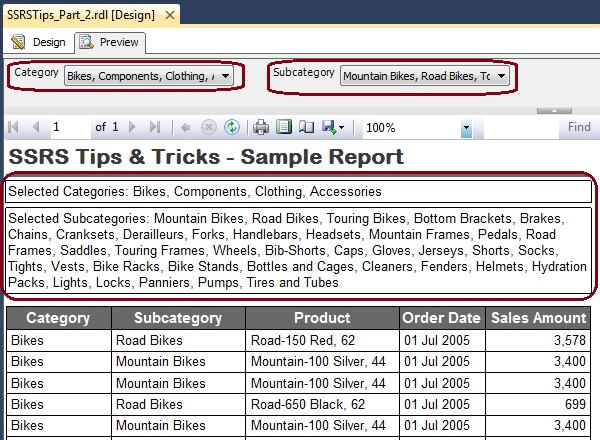
Now render the report with default values selected in both Category and Subcategory parameters and the rendered report looks as shown below.

Rendered report with default parameter selection

Next select "Bikes" under the Category Parameter and "Mountain Bikes, Road Bikes, Touring Bikes" under the Subcategory parameter and render the report and the rendered report looks as shown below.

Rendered report with default parameter selection

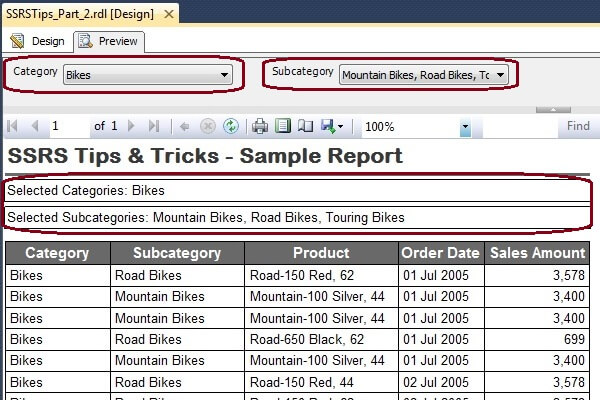
Notice that, based on the values selected in the parameters, the corresponding values/labels are displayed in the report. This can be really useful information specifically for users viewing the report offline.

Display No Rows Error Message for a SSRS Report

Sometimes when there is no data to display in the report, the rendered report is displayed as blank, which is not very intuitive to the end users. SSRS has a feature, which allows displaying a custom message when there are no rows to display in the table.

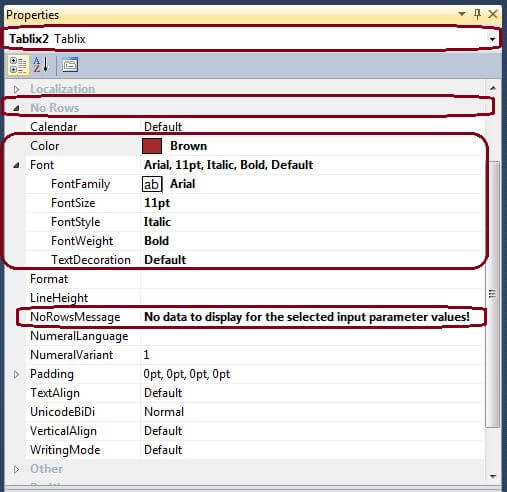
Select the Table and go Properties window and notice that there is a property called "NoRowsMessage" under "No Rows" category. Enter the following text as a value for that property. Notice that, you can either enter static text or it can be dynamic text based on an expression.

No data to display for the selected input parameter values!

Also, notice that, there are additional formatting options under "No Rows" category. Choose the font style, weight, color etc. and the properties windows should look as shown below.

Table Properties configuration for No Rows Error Message

"NoRowsMessage" property is applicable to Table, Matrix, and List data regions. The corresponding property for charts is "NoDataMessage" and for the color scale for a map is "NoDataText".

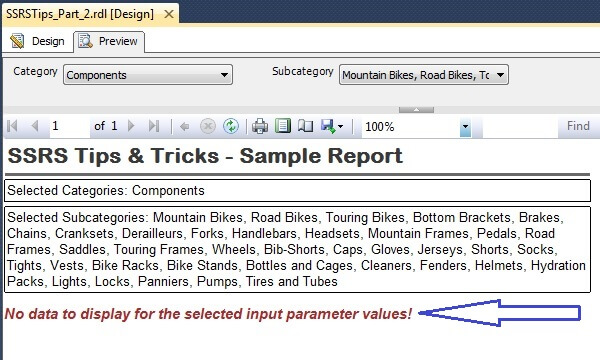
Now render the report by selecting "Components" in the Category filter and leave the default selection in the Subcategory filter. The output report should look as shown below.

Rendered report with No Rows Error Message

Page Settings for Optimal Printing for a SSRS Report

Often when the reports are exported or printed, we see different issues, which can be fixed by making appropriate page settings. Following are some of the commonly encountered issues:

  • Report items getting clipped across multiple pages. For instance, few columns appear on one page and next set of columns appear on a different page.
  • Blank pages appear in the PDF or Printed Versions.

To address this issue, we need to configure the page settings accordingly. Use the following rule of thumb while setting the width of a page.

Page Width >= Body Width + Left Margin + Right Margin

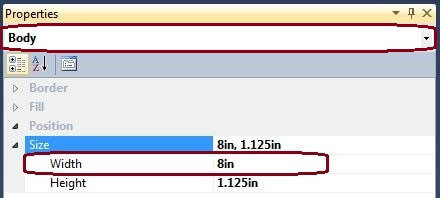
Make a note of the Width of the Report Body in the properties window. Make sure to select "Body" from the drop down while checking the size.

Total Pages showing correctly in navigation bar

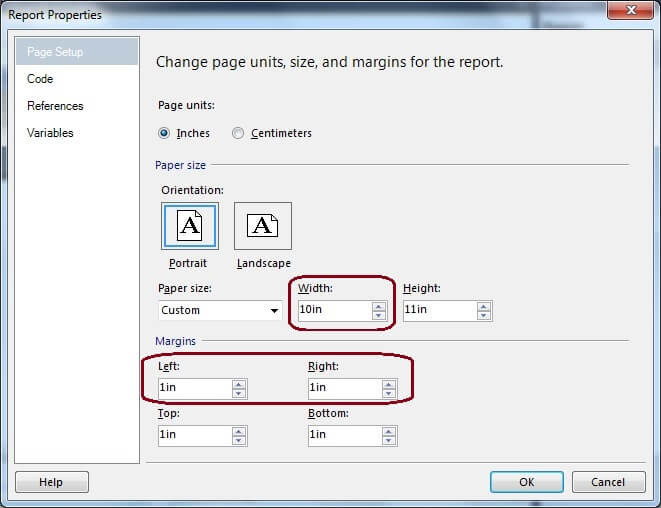
Now configure the page width as shown below. Go to "Report" --> "Report Properties..." --> "Page Setup".

Total Pages showing correctly in navigation bar

As we can see in this tip, SSRS is a very powerful reporting tool, and we just need to explore it to cater to most of the end user requirements.

Next Steps


sql server categories

sql server webinars

subscribe to mssqltips

sql server tutorials

sql server white papers

next tip


About the author
MSSQLTips author Dattatrey Sindol Dattatrey Sindol has 8+ years of experience working with SQL Server BI, Power BI, Microsoft Azure, Azure HDInsight and more.

This author pledges the content of this article is based on professional experience and not AI generated.

View all my tips


Comments For This Article


Saturday, February 27, 2021 - 9:27:59 PM - Imelda Chandra Back To Top (88313)
Sir, is it possible to set a report that can only print once by user ?

How to do that ?

Thank you in advanced

Tuesday, May 14, 2019 - 2:03:42 PM - Keith Langley Back To Top (80072)

My preference for reporting no data is to add a row outside of detail and use show/hide based on

CountRows("MyDataset")=0.

On that row merge all cells and add text "No Data Results Returned".

This will let you keep your report headers. It really helps let the user know what 'could' be there.


Tuesday, October 17, 2017 - 3:34:19 AM - Mustafa Back To Top (68467)

Hi Datta ,


Thanks for sharing across more information>
It would be helpdul if you give your inputs on implementing an editable textbox in ssrs.. I am using SSRS 2012. where the user wants to enter some comments on the report in runtime, before exporting it.

Thanks again!


Monday, August 21, 2017 - 4:10:04 AM - nirav Back To Top (65105)

 i am getting the report on aspx page with 52 pages but when i click on next page that aspx page become a blank it nothing to show why?


Friday, February 26, 2016 - 10:59:16 AM - Steve Back To Top (40802)

Thank you for the good information.  

What i am struggling with is a SSRS rpt with a few graphs in the body, that display fine as deployed, using the deployed to webpage.    However, in Sharepoint, i have the same embedded page as a webpart, the page headings are fine, but the body of the report is cut off and shows only the left side unless i scroll using the little bar under it, or set the zoom to "PageWidth" which displays both graphs, but still in the same small area.

How do i make body size of report display properly in sharepoint (native mode)?

(which i could include a screen print)


Tuesday, February 16, 2016 - 2:59:19 AM - SM Back To Top (40690)

I am using rdlc file in web page and have given print button to print report using script below.

Problem faced is i loose all the formatting lines in the print out.

Suggest how do i resolve this

 <script src="http://ajax.aspnetcdn.com/ajax/jQuery/jquery-1.11.0.min.js"></script>
    <script type="text/javascript">
        function PrintPanel() {
            var panel = document.getElementById("<%=pnlContents.ClientID %>");
            var printWindow = window.open('', '', 'height=400,width=800');
            printWindow.document.write('<html><head>');
            printWindow.document.write('</head><body >');
            printWindow.document.write(panel.innerHTML);
            printWindow.document.write('</body></html>');
            printWindow.document.close();
            setTimeout(function () {
                printWindow.print();
            }, 500);
            return false;
        }
    </script>


Thursday, May 21, 2015 - 12:31:25 PM - SZ Back To Top (37247)

I have expression in the report. it can be display on the report view but not shown on the print paper.

=iif(Globals!ReportServerUrl=

"http://wpg-dbserver-33/ReportServer","(TestServer)",""

)


Thursday, January 22, 2015 - 5:28:21 AM - rohit Back To Top (36018)

Dattatrey Sindol


do you  give reply or just sends you views then i can send the query to you. i found so many perople making fool to the user

regards


Wednesday, November 26, 2014 - 11:51:21 PM - Mani Back To Top (35422)

I am trying to export reports to PDF. I have the tablix property KeepTogether set to 'True' for printing all the group records in single page. But it is not working while exporiting to PDF files.


Any help??


Thursday, August 28, 2014 - 7:37:01 PM - Vonnie Back To Top (34327)

Please some help?? This is purely because I need to export in template form to Excel

The 'by qualification' report is exported to Excel to give details by qualifications

Unfortunately variations in columns displayed (Years 2011 - 2014) causes issues with linking to a template worksheet for qualification statistics and graphs in another excel worksheet

There is a base query of students enrolled in a Qualifications (Parameter is Qualification Code)  - the report gives headcount by year (plus many other criteria but this will do for now)

Qualifications vary in when they are taught, starting later than 2011, or ending before 2014

How to I force SSRS to give me all columns 2011 - 2014 even if there are no students enrolled in that Qual for that year


Q1 Year 2011 2012 2013 2014  
Headcount   1000 1000    
or          
Q2 Year 2011 2012 2013 2014  
Headcount 1000 1000      
or          
Q3 Year 2011 2012 2013 2014  
Headcount     1000 1000  


Saturday, July 26, 2014 - 7:07:37 AM - Dattatrey Sindol (Datta) Back To Top (33894)

Hi Papireddy,

For your requirement, you need to use the List Report Item in SSRS. For more information on this item, visit this msdn page: http://msdn.microsoft.com/en-us/library/dd239330.aspx

Hope this helps!

Best Regards,

Dattatrey Sindol (Datta)


Friday, July 25, 2014 - 3:02:03 AM - papireddy Back To Top (32876)

hi,

I have to generate contract forms for 400 employees. For this i have 8 pages static text and employee details data base. i have to change the employee name and desgnition, salary... in some pages. could you please tell me the development process? previously i worked on 2 projects in ssrs. this is new to me.


Friday, March 14, 2014 - 2:55:35 AM - Diwakar Back To Top (29752)

with the reference of the earlier post by K where his report is taking a minute to render ssrs reports while SP is taking just 8 sec.

My suggestion would be if you r using sub report then try to avoid that bcoz you won't get good performance.

Regards,

Diwakar


Friday, March 14, 2014 - 2:48:00 AM - Diwakar Back To Top (29751)

Excellent article. Thanks for sharing.


Thursday, February 27, 2014 - 1:15:02 PM - k Back To Top (29601)

Hi Datta,


Thanks for your time in replying to my question.

My report returns more than 200 K records based on a complex SP,  used report Assemblies and Custom Code for manipulations.

SP is taking 8 Sec to execute  and Report is taking 1 min to render and its fine but when exported its  taking almost 30+ min to export to Excel or PDF. 

Any thoughts why its taking such a long time?


Thanks,


Friday, February 14, 2014 - 12:09:47 PM - Jyothi Back To Top (29458)

Hi Datta,

Thanks for your quick response. After lot of  trial and error, i got the expression right and this works fine.

=IIF(Left(Lcase(Parameters!CompanyRegisteredName.Value),6) = "indian",false,true)

Lcase converts the text into lowercase and Left works as substring starting from left side.

I just tried the expression you gave(in 2005), and it works fine too.

Thanks again.


Friday, February 14, 2014 - 1:36:12 AM - Dattatrey Sindol (Datta) Back To Top (29443)

Hi Jyothi,


You can use the below expression:

=IIF(InStr(Parameters!CompanyRegisteredName.Value, "Indian Trust") > 0, false,True)

Since I do not have 2005 environment setup, I could not test it on 2005. However, I have tested this on 2012 and it works.

More information: http://msdn.microsoft.com/en-us/library/ms157328(v=sql.90).aspx


Hope this helps.

Best Regards,

Dattatrey Sindol (Datta)


Thursday, February 13, 2014 - 1:49:32 AM - Jyothi Back To Top (29424)

Hi Datta,

I hope you will respond to this post soon. This is related to SSRS 2005.

I have to include a text in my report. I have added the textbox and included the text in the expression.

Requirement is that this text needs to be displayed based on the parameter value. 

Suppose the parameter value is like '%Indian Trust%', then the text should be visible on the report.

Else text should be hidden. So i went to textbook properties, visibility section and tried adding below expresions.

Unfortunately none are working. Hope you have some solution for me.


=IIF(Parameters!CompanyRegisteredName.Value.Contains("Indian Trust"),False,True)

=IIF(Parameters!CompanyRegisteredName.Value like *Indian Trust*, True,False)

=IIf(Parameters!CompanyRegisteredName.Value.IndexOf("Indian Trust") > 0,True,False)

=IIF(instr(Parameters!CompanyRegisteredName.Value,"Indian Trust","01")>0,true,false)


Thanks for your time and help.


Tuesday, November 12, 2013 - 9:05:29 PM - Dattatrey Sindol Back To Top (27478)

Hi Hari,

For your scenario, you need a custom solution. You cannot use the No Rows Message feature. In your case, add a textbox right below your tablix and set the visibility for the textbox. This textbox should contain the required custom error message and this box should show up when there is no data, which you can check using an expression.

Hope that helps! 

Best Regards,
Dattatrey Sindol (Datta)


Tuesday, November 12, 2013 - 9:01:54 PM - Dattatrey Sindol Back To Top (27477)

Hi Robin,

FactInternetSales table is part of AdventureWorksDW database sample. Please download AdventureWorksDW database and you can see the table.

Best Regards,
Dattatrey Sindol (Datta)


Monday, November 11, 2013 - 8:53:59 AM - hari Back To Top (27458)

how to show header row when using tablix? if i use the no error message property the header is not showing. please help me how to get header row.


Wednesday, October 30, 2013 - 11:16:20 AM - Robin Back To Top (27336)

I downloaded Adventure works for my 2013 version of sql.  There is not a dbo named factinternetsales.  Did I download the wrong version?


Tuesday, September 3, 2013 - 4:17:17 PM - Margaret Back To Top (26597)

Hi Datta,

I wanted to ask if you could help me this: I am using the same method you mentioned in this article "Display No Rows Error Message for a SSRS Report". It worked great to show users when there is no data, but it always shows "No data Found" at my page initail load. Do you have solution to fix this?

This is what I have in my project: 

(1) Use Visual Studio 2010 created a website, and created one page aspx as my website.

(2) Insert a table on on the aspx page. Inside this table, I have three things: a textbox for user to enter their search string, and a search button (using asp:ScriptManager), and a panel. The panel contains rdlc report.

(3) the VB code set the report to refresh when Search button clicks.

It's all working well, except the page inital load. It will have "No Data Found" showing on the page while user hasn't done anything yet. How do I stop this happening. Your help will be greatly appreciated!


Tuesday, September 3, 2013 - 7:25:09 AM - John Back To Top (26587)

Any tips available to speed up rendering on complex reports? I have a report where the queries take 1 to 2 seconds in SSMS, the report that uses them takes almost a minute to render. Great article and the paramters on the report tip is especially good.


Wednesday, August 28, 2013 - 1:56:10 AM - Pavan Back To Top (26497)

Hi Thx you very much this post rocks.It help me sooo much.......


Friday, August 23, 2013 - 11:16:43 AM - Robin Back To Top (26459)

Thank you!  Excellent Article!


Friday, August 23, 2013 - 3:45:15 AM - Nilesh Argade Back To Top (26448)

This is excellent article and thanks for sharing nice tips.


1 thing I want to share from my reporting experience.


Our report displays chosen parameters which are multivalve type e.g. Building "Code + Building Name", "Sector" and "Manager Name". Initially we display chosen parameter values same as you shown above. However, when we export report in excel it fail to display entire string or all values due to the cell's limitation in excel. A cell can contain only 32767 characters.


For that issue we wrote a custom code which displays each record on new cell of table, instead of displaying everything in 1 cell.


Friday, August 23, 2013 - 1:27:52 AM - Vashistar Back To Top (26446)

Thanks. This SSRS tips will be very useful..


get free sql tips
agree to terms