Problem
The Power BI desktop designer is a great tool. However, the hardest part of any Business Intelligence (BI) project is gathering and formatting the data into reportable datasets. How can we get a better understanding of the internal workings of Power BI to have better reporting?
Solution
Microsoft has been working on self service Business Intelligence (BI) tools since the introduction of Power View for SharePoint 2010. All previous tools, Power Pivot, Power View, Power Query and Power Map, were add-ins to the Microsoft Excel application. Thus they were bound to the Microsoft Office software release schedule. Since changes are rapidly happening in the IT world, the Power BI offering was separated into the cloud offering and desktop designer.
Recently, Microsoft has released its latest desktop version for public preview in July 2015. The Power BI desktop designer can be downloaded from the following link.
The designer is based upon Power Query to import data into the model. The x-velocity engine is used to save the data in a space saving format. The imported datasets can be related via relationships. The report visualizations can be categorized into different dashboard pages. This part of the designer is based upon Power View. If you have worked with Power Query and Power view in the past, you will be right at home.
The data section of the Power BI designer is where you import and manipulate data. Just like SQL Server Management Studio which obscures the T-SQL generated by menu selections and actions, the Power BI designer is based upon the Power Query formula language informally know as “M”. Having a deeper understanding of the M language will help a BI developer in cases where the menus can not.
Business Problem
An assistant professor at the Paris Technical college was kind enough to publish some sample datasets on his web site. The only restriction was to cite the authors (Petra Isenberg, Pierre Dragicevic and Yvonne Jansen) who cleaned up the data. Today’s business problem is to load and clean up the CARS dataset.
Importing Data
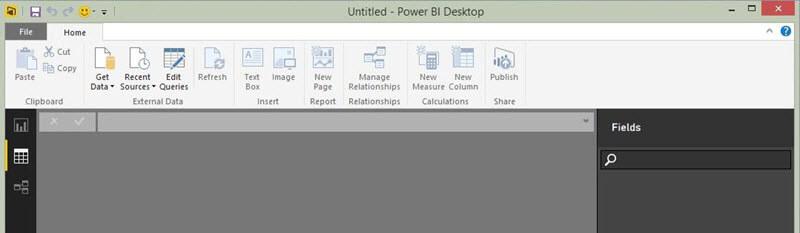
The first step is to launch the Power BI desktop designer. The opening page gives the user references to forums, blogs and tutorials. Also, any recent data sources and designer files are listed for quick access in the left hand side. If you do not want to see this page again, make sure the “show on startup” option is unchecked.

Close the opening page to see the designer with an empty workspace. The designer has three tabs on the left which are key to any project. The middle tab is the data tab where queries are written to load and clean datasets. The bottom tab is used to define relationship between datasets. The top tab is used to create dashboard pages that visualize the data.
Choose the get data option from the ribbon at the top. Select the CSV file option on the sub-menu.

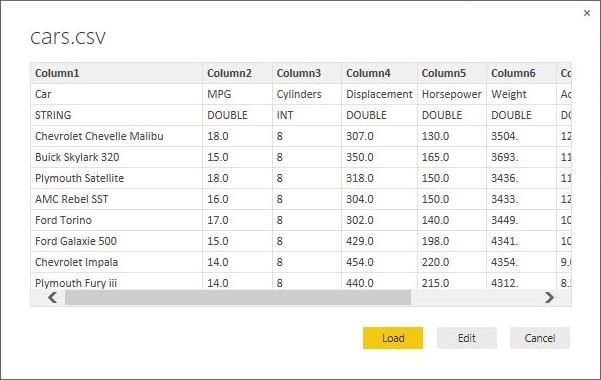
The Power BI Designer can handle many different data types. Since the purpose of these tips is to focus on data manipulation using the M language, the CARS dataset is a very simple comma separated value file. Browse to where you saved the sample data file from the above website.

Clicking the open button loads the data into a preview window. The user can either LOAD the data without manipulation, EDIT the data or CANCEL the current operation. Choose the EDIT option to manipulate the data using a set of steps in a query.
Again, if you are familiar with Power Query, you will be right at home. The designer used to have the look and feel of the Microsoft Office Excel product. The color scheme was green and white. With the final release of the desktop designer product from the public preview, the screens now match the look and feel of the cloud based offering.

The preview of the data after loading from source shows the first two lines are not part of the data. Choose the use first line as header from the ribbon above. This will show up as a promote header action in the applied query steps.
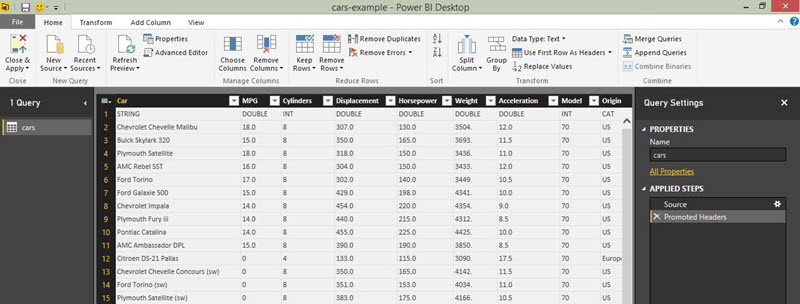
The second line of data describes the column types of the data set. Choose remove N top rows from the ribbon above.
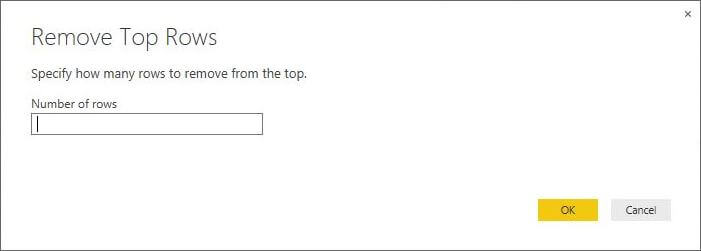
Enter the number one to remove the unnecessary row.
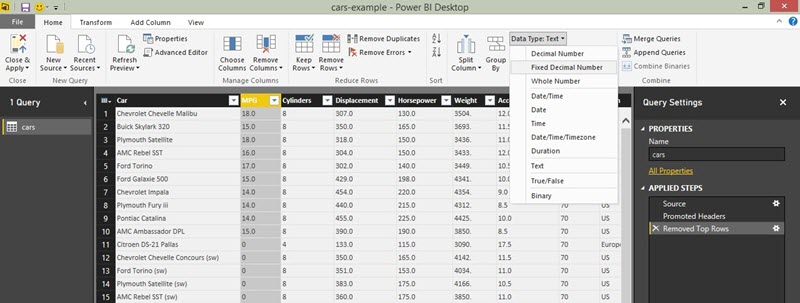
Many times numeric, date or time data comes in as text. We will want to change the data type in the model so that aggregations can be used in our dashboard reports.
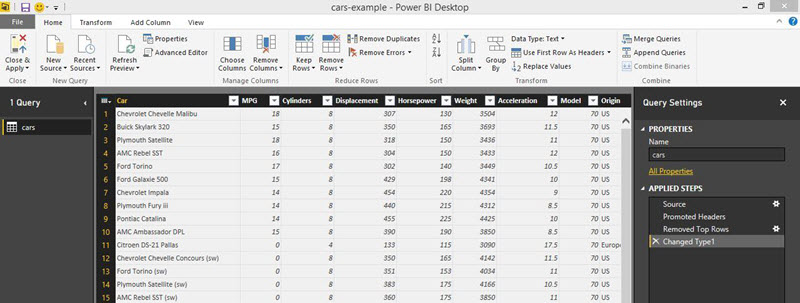
All columns except for the cars name and origin have been formatted as an numeric type.

The properties option on the ribbon above allows the designer to rename the dataset. Another nice option is the ability to add comments along with the query.
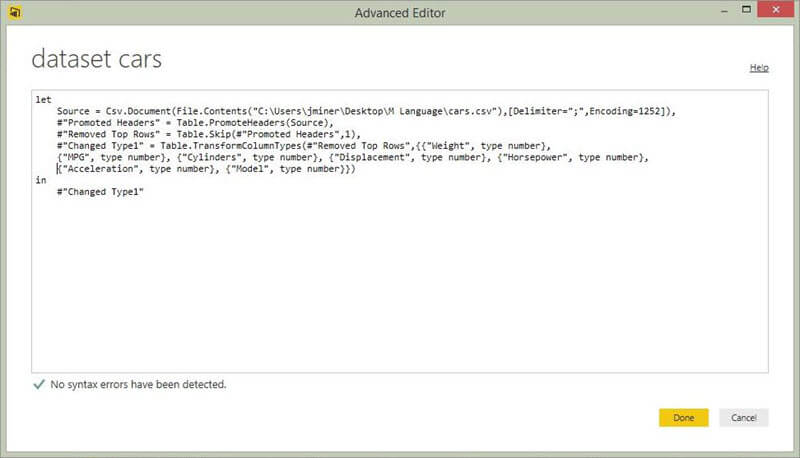
All the work we have done so far has been building up to this moment. The advance editor shows the M language statements used in our query. I do not suggest you abandon the menus right now and get out the specification for the M language. However, I will introduce custom (computed) columns in future tips. Having a strong handle on the language will allow you manipulate data when the menus will not suffice.

So far, no data has been loaded to the data model. Choose the close and apply button from the above ribbon.

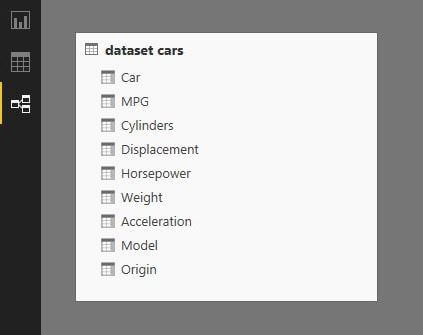
After the query designer window closes, we are place back on the data tab. We now can see the [dataset cars] with associated fields. Everything except for the text fields has a summation sign. This means those fields can be aggregated in dashboard reports.
Switching to the relationship tab, we can see the same dataset in a graphical object that one might find in a Entity Relationship Diagram. Since we have only one simple table, we can not build relationships at this time.
Summary
The Power BI desktop designer is a FREE and powerful tool that will allow an end user to quickly import data into the model. There are many options on the ribbon that can be selected to manipulate the data. The advance editor shows the user the actual M language statements that were create by the menus selections.
Most of the menu options correspond to simple manipulations. Complex formulas can be created by using the M Language (Power Query Formulas) within a custom (computed) column. Having a strong handle on the language will allow you manipulate data when the menus will not suffice.
Next Steps
- Introducing computed columns to the cars dataset.
How can we round numbers?
- The earliest use of computers was to manipulate numbers.
Can we perform advanced mathematical formulas?

John Miner is a Senior Data Architect at Insight Digital Innovation helping corporations solve their business needs with various data platform solutions.
He has over thirty years of data processing experience, and his architecture expertise encompasses all phases of the software project life cycle, including design, development, implementation, and maintenance of systems.
His credentials include undergraduate and graduate degrees in Computer Science from the University of Rhode Island. Also, he has earned certificates from Microsoft for Database Administration (MCDBA), System Administration (MCSA), Data Management & Analytics (MCSE), Data Science (MPP), Databricks Certified, and Fabric Certified.
John has been recognized with the Microsoft MVP award nine times for his outstanding contributions to the Data Platform community.
When he is not busy talking to local user groups or writing blog entries on new technology, he spends time with his wife and daughter enjoying outdoor activities. Some of John’s hobbies include wood working projects, crafting a good beer and playing a game of chess.
- MSSQLTips Awards: Author of the Year – 2019, 2022, 2023 | Champion (100+tips) – 2023


