By: Svetlana Golovko | Comments | Related: > Query Store
Problem
One of the new features of SQL Server 2016 to learn is Query Store. In one of our last tips about Query Store we reviewed how to configure and access Query Store runtime statistics with SQL Server Management Studio (SSMS). We also provided examples of the Query Store usage and wrote about some useful queries.
In this tip, we will look at the other Query Store options within SQL Server Management Studio (SSMS).
Solution
In the previous Query Store tips we primarily used only one of the Query Store SSMS panes - "Top Resource Consuming Queries". In this tip we will review the remaining Query Store panes:
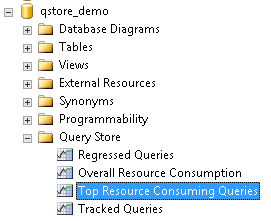
Tracked Queries in the SQL Server Query Store
There are several ways to open the "Tracked Query" pane.
Once you have a query you want to track highlighted in the "Top Resource Consuming Queries" pane or "Regressed Queries" pane you can click on the "Track the selected query..." button:
If you know a query ID you can use the "Tracked Query" Query Store pane directly and continue monitoring this specific query. Open the "Tracked Query" pane from SSMS and enter the query ID you would like to track (1):
You can configure the time interval (2) different from the default one ("Last day").
You can also choose a different metric ("Duration" is the default):
When you track a query you can refresh the results manually or set the pane to "Auto-update" (3). This will automatically update the pane every 5 seconds. Auto update is also configurable and you can set it to different intervals.
Similar to the "Top Resource Consuming Queries" pane you can compare plans, view the query or force selected plan here.
Regressed Queries Pane in SQL Server Management Studio
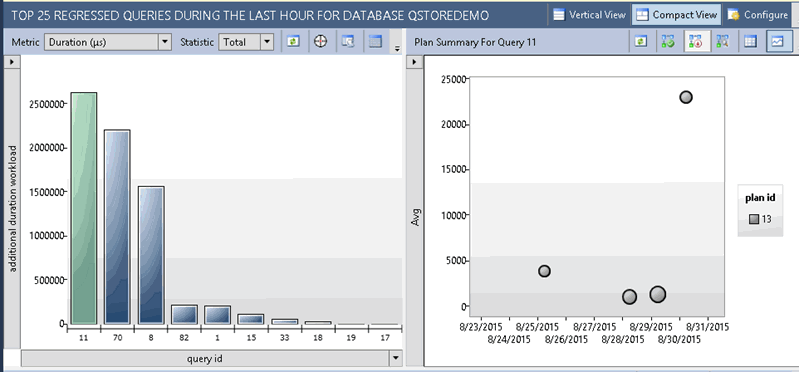
The "Regressed Queries" pane displays queries regressed for example in Duration (default) during the last week (default history interval):
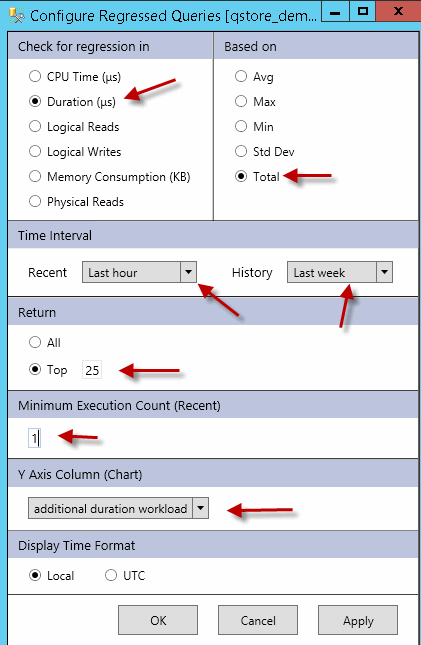
Click on the "Configure" button and note the rest of the default configuration values:
In our case we want to change the configuration to show queries regressed in logical reads. We also want to show only queries that were executed at least 10 times:
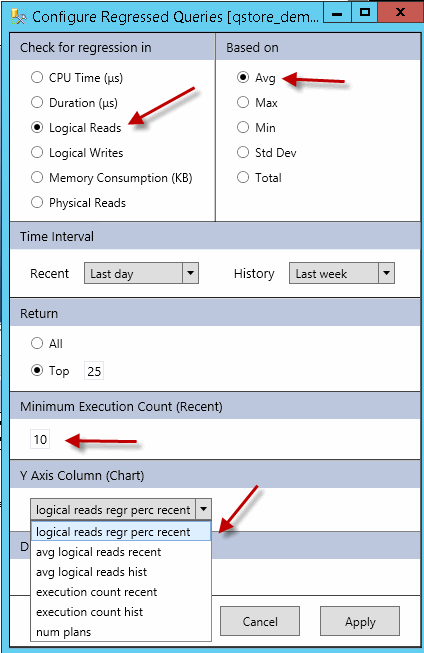
Note the "Y Axis" dropdown metrics that are available.
The pane's Vertical View (as well as Grid View for the left part of the pane) will give you a little bit better presentation of the regressed query details:
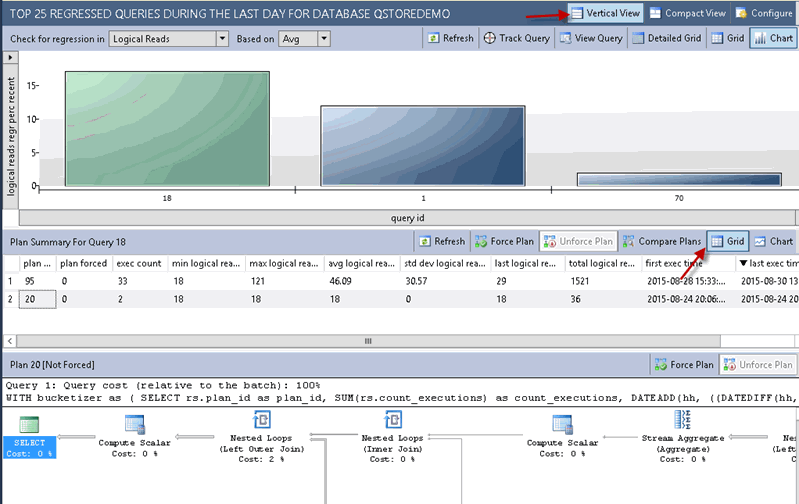
Overall Resource Consumption
The last pane to review is the "Overall Resource Consumption" pane:
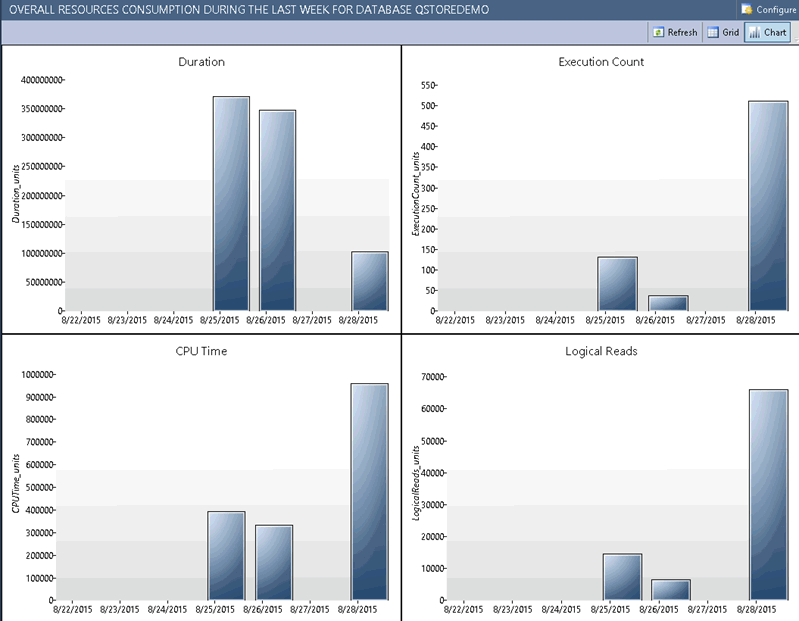
By default it will display CPU time, Duration, Execution Count and Logical Reads for the last week aggregated by hour:
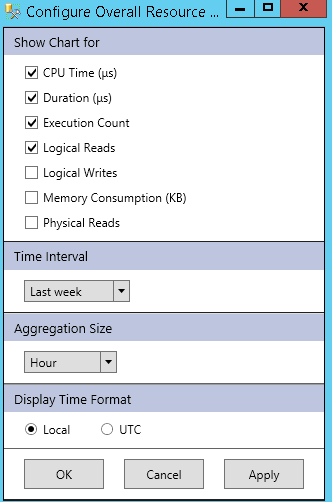
When you switch to the Grid View you will be able to view all of the available metrics for the resource consumption grouped by the aggregation size selected in the configuration:

From both - grid and chart view you can drill down to the details by double-clicking one of the values in the grid view or by clicking one of the bars in the chart view. The "Top Resource Consuming Queries" pane will be opened for the specified period of time (for the bar or row that was clicked).
In our example we clicked on the "Execution Count" area of the "Overall Resource Consumption" pane in the chart view. It opened the "Top Resource Consuming Queries" pane filtered by the execution count:
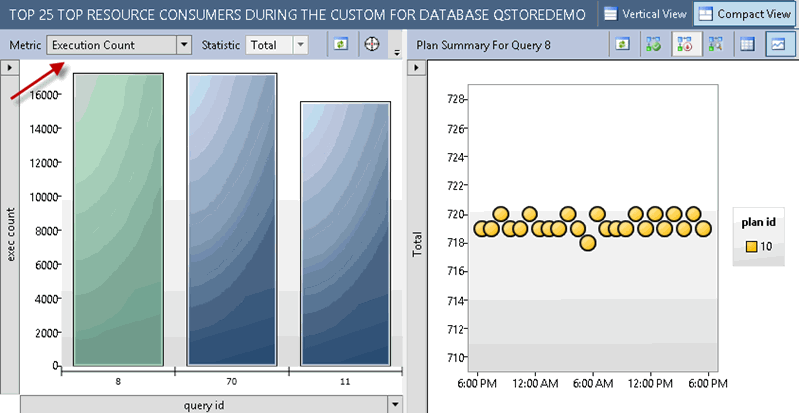
When you click on the "CPU Time" area of the "Overall Resource Consumption" pane in chart view it will open for you accordingly the "Top Resource Consuming Queries" pane filtered by the CPU Time, and so on for each area of the chart.
Now we will double-click on the grid view - on row #1 "total logical reads" value:

The "Top Resource Consuming Queries" pane will open and it will be filtered by the total logical reads:
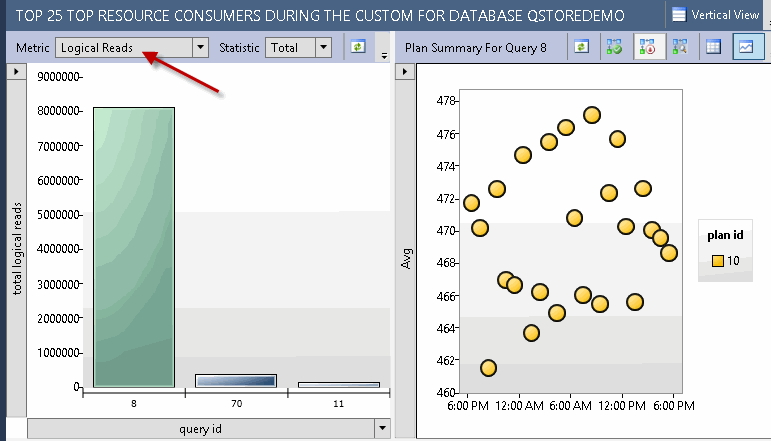
Note, that in this version you can not click on the "total execution count" in the grid view. This might be fixed in the RTM version of the SQL Server 2016.
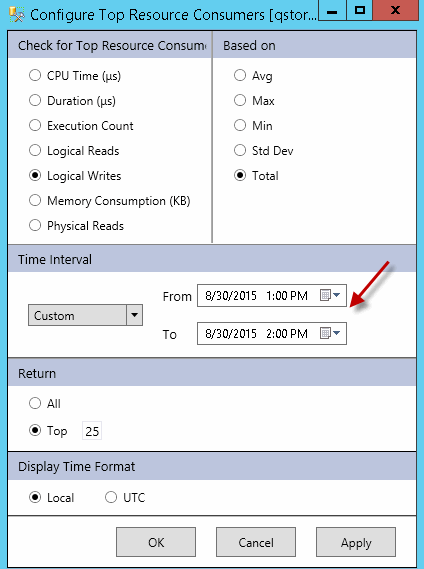
Note as well, that the results in the "Top Resource Consuming Queries" pane will be filtered by the interval selected on the chart view or the grid view of the "Overall Resource Consumption" pane. So, if you configured the "Overall Resource Consumption" pane to display results by hour your results will be displayed for the selected hour.
You can confirm this by clicking on the "Configure" button under the details (in the "Top Resource Consuming Queries" pane):
Summary
In this tip we have reviewed the last three Query Store panes. We have reviewed the default configuration settings and provided explanations on what drill down options are available.Note: This article was written based on SQL Server 2016 CTP 2.2. Some screens and behaviors may change in final release. For example, in SQL Server 2016 CTP 2.3 "Vertical View" and "Compact View" buttons were renamed to the "Portrait View" and "Landscape View" correspondingly.
Next Steps
- Download the latest evaluation version of SQL Server 2016.
- Read SQL Server 2016 Books Online documentation.
- Read how to Monitor Performance By Using the Query Store.
- Read other tips on SQL Server 2016.
About the author
 Svetlana Golovko is a DBA with 13 years of the IT experience (including SQL Server and Oracle) with main focus on performance.
 This author pledges the content of this article is based on professional experience and not AI generated.
View all my tips


