Problem
The SQL Server Query Store is a wonderful tool to keep track of query performance of a database over time, it provides insight about query execution plans, query text and runtime statistics. Depending on the database and application workload, the Query Store will eventually store more and more data until it reaches the max size configured for the Query Store. The database will continue operating normally, but new query performance data will be not captured because the Query Store will automatically switch to read-only mode when this happens. SQL Server Management Studio (SSMS) provides a graphical representation of the Query Store storage utilization, but this is not a very practical way to get this information for a large SQL Server environment with multiple databases. Below is a screen shot of the Query Store properties using SSMS where we can see the current status for the WideWorldImporters database.

In this tip we will look at how we can capture this information using T-SQL.
Solution
As noticed from the image above, SSMS has a simply pie chart that shows the Query Store Available and Used storage, the goal of this tip is to reproduce the same information using T-SQL so we can customize and monitor this storage utilization in a better way for our databases.
The Query Store has a set of DVMs which provides all the information you see in SSMS, let’s take a look at each of the DMV’s available:
| Query Store Catalog View | Description |
|---|---|
| sys.database_query_store_options | Returns the Query Store options for this database |
| sys.query_context_settings | Contains information about the semantics affecting context settings associated with a query |
| sys.query_store_plan | Contains information about each execution plan associated with a query |
| sys.query_store_query | Contains information about the query and its associated overall aggregated runtime execution statistics |
| sys.query_store_query_text | Contains the Transact-SQL text and SQL handle of the query |
| sys.query_store_wait_stats | Contains information about the wait information for the query |
| sys.query_store_runtime_stats | Contains information about the runtime execution statistics information for the query |
| sys.query_store_runtime_stats_interval | Contains information about the start and end time of each interval over which runtime execution statistics information for a query has been collected |
The information in detail of each one of these DMV’s can be found in these Microsoft docs. If you look at the link, you can see the documentation about these DVM’s is very good. Is not that hard to understand how to pull the information we are looking for, specifically storage utilization.
Queries to get SQL Server Query Store Options and Status
First we need to understand the current Query Store configuration, the storage configuration details can be found using the sys.database_query_store_settings DMV for this purpose. I will use the WideWorldImporters database for these examples, but this can be used for any database that is using the Query Store.
Let’s run a basic query to get the following basic information:
- Current size in megabytes
- Max storage reserved in megabytes
- Query Store status
- Read only reason (in case it’s in this state)
- Cleanup policy
- Size cleanup mode (OFF \ AUTO)
USE [WideWorldImporters]
GO
SELECT
   current_storage_size_mb,
   max_storage_size_mb,
   actual_state_desc,
   readonly_reason,
   stale_query_threshold_days,
   size_based_cleanup_mode_desc
FROM sys.database_query_store_options;
GO
Here is the output from the query:
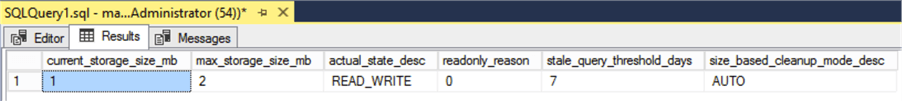
This query works just fine, it provides the basic information about the Query Store status for this database and how much space its utilized, but this information is not enough to have a full understanding of the Query Store storage utilization and status.
It is very likely that at some point the Query Store can run out of space, the readonly_reason column returns a “code” (in this case zero) to explain what happened which is not convenient, also there is no real space utilization just the actual and max size of Query Store.
I did some research about the read only reason, and found the description about every single code in these Microsoft docs:
| Read only code | Description |
|---|---|
| 1 | Database is in read-only mode |
| 2 | Database is in single-user mode |
| 4 | Database is in emergency mode |
| 8 | Database is a secondary replica (applies to Availability groups and Azure SQL Database geo-replication). This value can be effectively observed only readable on secondary replicas |
| 65536 | The Query Store has reached the size limit set by MAX_STORAGE_SIZE_MB option |
| 131072 | The number of different statements in Query Store has reached the internal memory limit. Consider removing queries that you do not need or upgrading to a higher service tier to enable transferring Query Store to read-write mode. Only applies to SQL Database |
| 262144 | Size of in-memory items waiting to be persisted on disk has reached the internal memory limit. Query Store will be in read-only mode temporarily until the in-memory items are persisted on disk. Only applies to SQL Database |
| 524288 | Database has reached disk size limit. Query Store is part of user database, so if there is no more available space for a database, that means that Query Store cannot grow further anymore. Only applies to SQL database |
I found this information really valuable, because it is always nice to know for what reason the Query Store stopped tracking queries and went from “READ WRITE” to “READ ONLY”.
The following query includes the read only reason identification using a case, it also has the storage utilization calculation:
USE [WideWorldImporters]
GO
SELECT
   DB_NAME() as "Database Name",
   actual_state_desc as "Actual State",
   FORMAT(current_storage_size_mb, 'N0') as "Current Storage Size (MB)",
   FORMAT(max_storage_size_mb, 'N0') as "Max Storage Size (MB)",
   CAST(current_storage_size_mb AS FLOAT)/CAST(max_storage_size_mb AS FLOAT) "Storage utilization %",
   CASE
      WHEN readonly_reason = 1 THEN 'Database in read-only mode'
      WHEN readonly_reason = 2 THEN 'Database in single-user mode'
      WHEN readonly_reason = 4 THEN 'Database in emergency mode'
      WHEN readonly_reason = 8 THEN 'Database is secondary replica'
      WHEN readonly_reason = 65536 THEN 'Query Store has reached the size limit set by the MAX_STORAGE_SIZE_MB option'
      WHEN readonly_reason = 131072 THEN 'The number of different statements in Query Store has reached the internal memory limit'
      WHEN readonly_reason = 262144 THEN 'Size of in-memory items waiting to be persisted on disk has reached the internal memory limit'
      WHEN readonly_reason = 524288 THEN 'User database has reached disk size limit'
      ELSE 'N\A'
   END as "Read only Reason",
   stale_query_threshold_days as "Cleanup policy",
   size_based_cleanup_mode_desc as "Size based cleanup mode"
FROM sys.database_query_store_options
GO
Here is the output from the query:

This query works really well providing you details about the status, storage utilization and the description of the read only reason in case Query Store goes in that status.
Next Steps
- Create an automated process to collect this information
- Create a notification process to page DBA’s when Query Store runs out of space
- Learn more how to monitor performance using Query Store
- Read more about Automatic Query tuning tips
- Check previous tips about SQL Server 2017 tips

Carlos Robles is a Microsoft Data Platform MVP and multi-platform DBA. With over 10 years of experience in the database administration field, he has worked with different platforms (Linux, Windows, Unix, on-premise, virtual, cloud) for large scale US based companies from different industries like healthcare, food, energy, technology, insurance, and banking. Carlos has multiple certifications (MCP, MCTS, MCSA, MCSE) from SQL Server 2008 until 2016 including Azure SQL DB, ITIL v3 and recently got certified in Docker Containers, Kubernetes, and RedHat redshift. He has developed a few open-source tools like MAXDOP Calculator and Wait Stats widget for Azure Data Studio; If you have a chance, take a look at his GitHub repository.
- MSSQLTips Awards: Rookie of the Year Contender – 2019


hello and thank you for the nice article! i think in the query is missing *100 in the [% used] , 1 on 2 is 50% not 0,5%