Problem
You have to troubleshoot a SQL Server session that is taking longer than normal to complete. In this tip I will show a new SQL Server 2016 Dynamic Management View that will make it easier to understand how time is spent for the session being analyzed.
Solution
One of our main responsibilities as SQL Server DBA’s is the tuning of processes. Usually the first thing we do is to look at the execution plan to have a picture of what the process under analysis is doing. If we detect an issue in the execution plan then we take corrective action. Although this is the best approach to troubleshoot query performance, it may not be the best first step to troubleshoot a whole process. Usually a process issues a set of queries over the same session, so if your first step is to look at execution plans, then you could end up analyzing lots of query plans.
Under those circumstances what we need to do is to take a look at how time is being spent during the session lifetime. Yes, I am referring to Wait Types. On versions of SQL Server before 2016 it was very difficult to obtain statistics of wait types for a session; we were limited to getting the actual wait types for the whole server instance by querying the sys.dm_os_waiting_tasks Dynamic Management View.
sys.dm_exec_session_wait_stats Dynamic Management View
Amongst the new features and improvements of SQL Server 2016 there is a new execution related Dynamic Management View called sys.dm_exec_session_wait_stats. Its name is similar to the well-known Operating System related Dynamic Management View sys.dm_os_wait_stats. In fact the sys.dm_exec_session_wait_stats system view returns the same set of columns of sys.dm_os_wait_stats view with the addition of a session_id column.
This system view returns information about all the waits for each session and allows us to do a quick high level diagnosis of a session's work.
Column name | Description |
|---|---|
| session_id | The id of the session. |
| wait_type | The name of the wait type. You can get the full list of wait types at the MSDN page for sys.dm_os_wait_stats Dynamic Management View. |
| waiting_tasks_count | Number of occurrences of this wait type over session’s lifetime. |
| wait_time_ms | The total wait time for this wait type in milliseconds including the signal wait time. |
| max_wait_time_ms | Maximum wait time on this wait type. |
| signal_wait_time_ms | This is the difference between the time that the execution thread was signaled to start executing and the time this thread started running. A high signal wait time may be a sign of CPU pressure. |
Something to consider regarding the column names is that if you have your own queries on sys.dm_os_wait_stats view, then you can use those queries with little modifications.
Another interesting fact is that this system view resets the information for a session when the session is closed and a new session reuses the same session_id, or when the session is reset, if the session uses connection pooling.
DBCC SQLPERF Behavior on sys.dm_exec_session_wait_stats
If you remember the lessons on sys.dm_os_wait_stats then you may remember that there is a DBCC command that resets the contents of this system view:
DBCC SQLPERF ('sys.dm_os_wait_stats', CLEAR);
GO
Being that the sys.dm_exec_session_wait_stats Dynamic Management View is similar to sys.dm_os_wait_stats system view, an interesting question we can ask ourselves is what will happen if we execute the previous DBCC command with the data of sys.dm_exec_session_wait_stats view. At first you may think that the data will be reset, but surprisingly it persists.
sys.dm_exec_session_wait_stats Demonstration
Now I will show you a simple example of how the sys.dm_exec_session_wait_stats system view works. Let’s create a sample database.
USE [master]
GO
CREATE DATABASE [sampleDB]
 CONTAINMENT = NONE
 ON  PRIMARY
( NAME = N'sampleDB', FILENAME = N'C:\MSSQL\sampleDB.mdf' ,
 SIZE = 10240KB , MAXSIZE = UNLIMITED, FILEGROWTH = 1024KB )
 LOG ON
( NAME = N'sampleDB_log', FILENAME = N'C:\MSSQL\sampleDB_log.ldf' ,
SIZE = 10240KB , MAXSIZE = 2048GB , FILEGROWTH = 128MB)
GO
The following query will create a test table with some data.
USE SampleDB
GO
SELECT  A.name ,
        A.id ,
        A.xtype ,
        A.uid ,
        A.info ,
        A.STATUS
INTO    TestTable
FROM    sys.sysobjects A
        CROSS JOIN sys.sysobjects B
        CROSS JOIN sys.sysobjects C
GO
In a new query window, run the next query. I decided to use a simple query to show this Dynamic Management View because the query is irrelevant to learning how this view works.
USE SampleDB
GO
SELECT  DENSE_RANK() OVER ( PARTITION BY name ORDER BY name )
FROM    dbo.TestTable
WHERE   name LIKE '%s%'
GROUP BY name
GO
Keep note of the session_id at the bottom of the query window or in the title bar.

Now in another query window we are going to query the sys.dm_exec_session_wait_stats system view filtering the results by the session_id of the previous step.
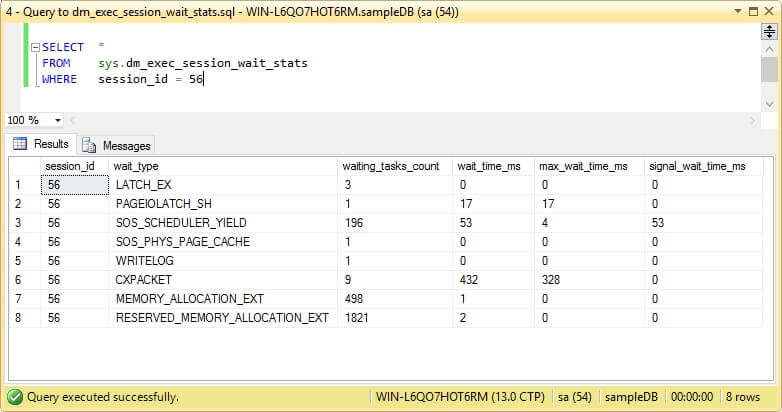
SELECT  *
FROM    sys.dm_exec_session_wait_stats
WHERE   session_id = 56
You will get a result set like on the next screen shot. Of course, you may not have the same wait types as the image.
To test the behavior of DBCC SQLPERF command lets query the sys.dm_os_wait_stats operating system view filtering by the wait types from the session being analyzed.
SELECT  OS.* ,
        S.Session_Id ,
        S.waiting_tasks_count ,
        S.wait_time_ms ,
        S.max_wait_time_ms ,
        S.signal_wait_time_ms
FROM    sys.dm_os_wait_stats OS
        INNER JOIN sys.dm_exec_session_wait_stats S ON OS.wait_type = S.wait_type
WHERE   S.session_id = 56
The next image shows a screen capture of the execution of the previous statement.
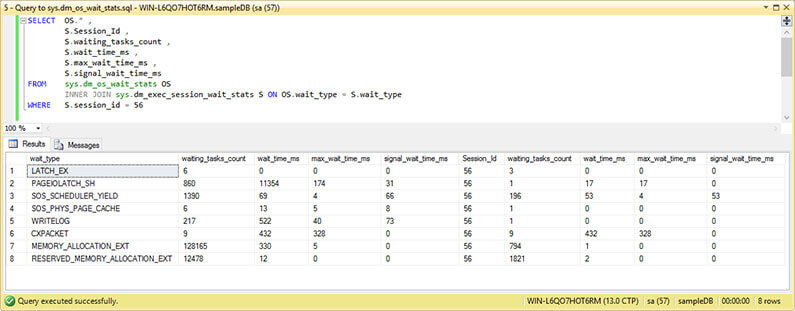
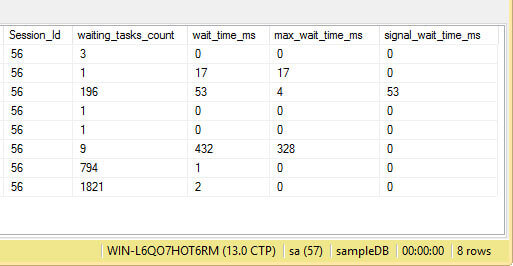
In order for you to see the values with more clarity, I split the result pane into two separate images.

Now let’s reset sys.dm_os_wait_stats data with the DBCC SQLPERF command and re-execute the previous query.
DBCC SQLPERF ('sys.dm_os_wait_stats', CLEAR);
GO
SELECT  OS.* ,
        S.Session_Id ,
        S.waiting_tasks_count ,
        S.wait_time_ms ,
        S.max_wait_time_ms ,
        S.signal_wait_time_ms
FROM    sys.dm_os_wait_stats OS
        INNER JOIN sys.dm_exec_session_wait_stats S ON OS.wait_type = S.wait_type
WHERE   S.session_id = 56
GO
Here is the screen capture of the previous statement execution.

Like before, in order for you to see the values with more clarity, I split the result pane into two separate images.


As you can see, resetting the data of sys.dm_os_wait_stats operating system view doesn’t affect the values of sys.dm_exec_session_wait_stats view.
Next Steps
- You can download an Evaluation copy of SQL Server 2016 from this link: https://www.microsoft.com/en-us/evalcenter/evaluate-sql-server-2016.
- As I said, you can reuse the queries to sys.dm_os_wait_stats. In this tip you have some queries and a good explanation of sys.dm_os_wait_stats system view: SQL Server sys.dm_os_wait_stats DMV Queries.
- If you need more information about Dynamic Management Views check out Dynamic Management Views and Functions Tips Category.
- You can find more tips about Performance Tuning on Performance Tuning Tips Category.
- Stay tuned to the SQL Server 2016 Tips Category for more information about this release of SQL Server.

Daniel Farina was born in Buenos Aires, Argentina. Self-educated, since childhood he showed a passion for learning. He studied at Universidad de Buenos Aires. Daniel started working as a programmer at a young age. Over the years he specialized in databases, particularly SQL Server and Oracle. Now with 30 years of age, his work experience includes working with various technologies like VB, C, .NET, web development, Windows and Linux systems. He likes to read about science, psychology, philosophy and many other things. In his spare time, he trains powerlifting aiming to compete.
- MSSQLTips Awards: Author of the Year – 2018 | Champion (100+ tips) – 2018 | Author Contender – 2015-2017, 2019