By: Daniel Farina | Comments (5) | Related: > Monitoring
Problem
You are using SQL Server Management Studio Performance Dashboard Reports to monitor and troubleshoot SQL Server and you want to receive an email from the report when there is blocking on the database, as an example. In this tip I will show you how to import Performance Dashboard reports into Reporting Services and to configure a data driven subscription to send an email with the report when the conditions apply.
Solution
In my previous tip SQL Server Management Studio Performance Dashboard Reports Overview I showed you the capabilities of this set of reports to troubleshoot performance related issues and to monitor your SQL Server instance. Now I will show you how to import this set of reports into Reporting Services, which will allow us to subscribe to the reports and receive them via e-mail. If we take advantage of Data Driven Subscriptions we can program the report to be delivered only when there is something interesting to report.
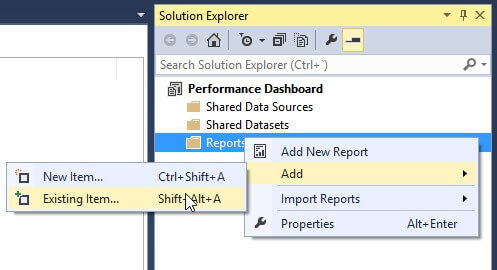
First we need to create a new Report Server project in the SQL Server Data Tools and import the reports that usually are located in the following path C:\Program Files (x86)\Microsoft SQL Server\110\Tools\Performance Dashboard. To do so, on the Solution Explorer window right click on the Reports folder and from the drop down menu select Add -> Existing Item.
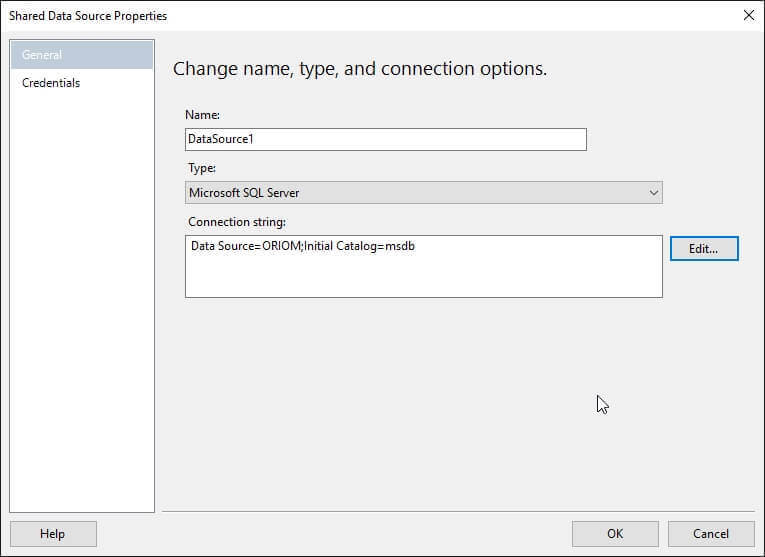
Since all of the reports use a shared data source named DataSource1 we must create a shared data source with that name pointing to the msdb database of the SQL Server instance we are planning to monitor.
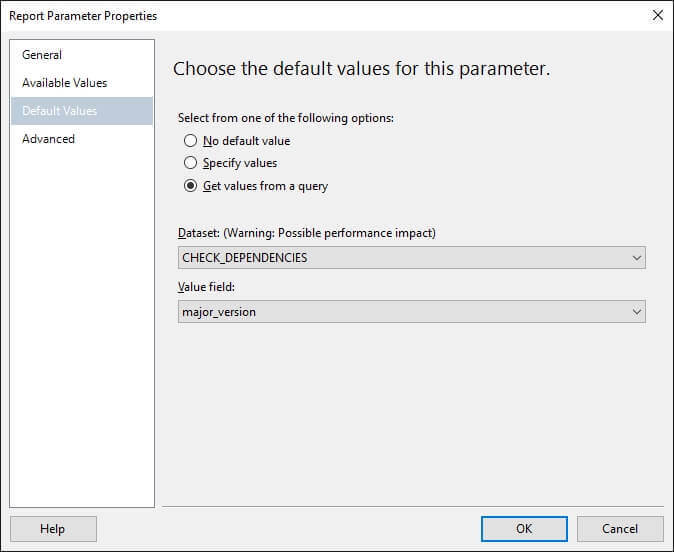
Another item to take care of is that all of the reports receive a parameter named version_string from the main report to validate the SQL Server version. This is necessary to run all of the reports separately with a data driven subscription. The way I do so is to define a default value for this parameter. I choose to configure the reports to get the parameter value from the mayor_version field of the CHECK_DEPENDENCIES data set like the following image shows.
Once you deploy the project to the Report Server you should verify that the credentials of the data source are stored in the server, otherwise it won't be possible to create a subscription.
Creating the Data Driven Subscription
To create the Data Driven Subscription for the blocking report as well as any other report you want to subscribe, you should right click on the report and on the drop down menu select the Manage option. You may be tempted to select the Subscribe option, but it will create a standard subscription and that is not what we want.
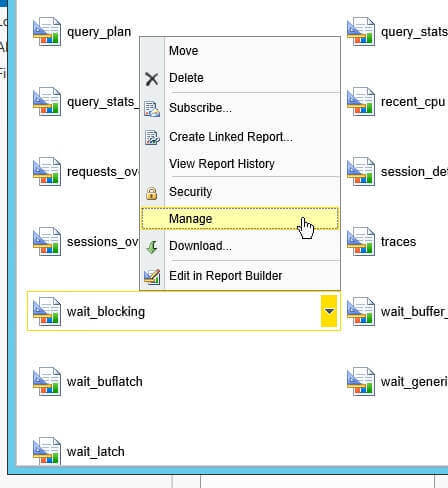
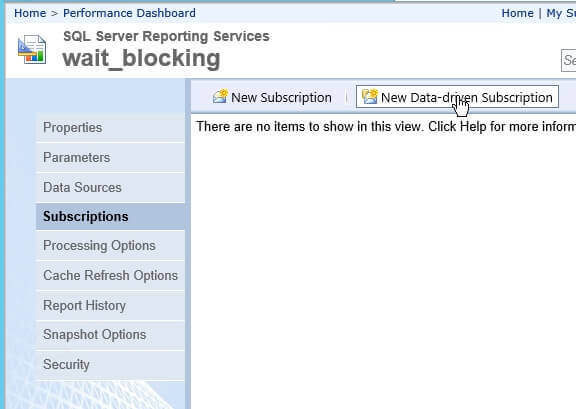
When the management page opens, go to the Subscription tab and press the New Data-Driven Subscription button to launch the Data-Driven Subscription wizard.
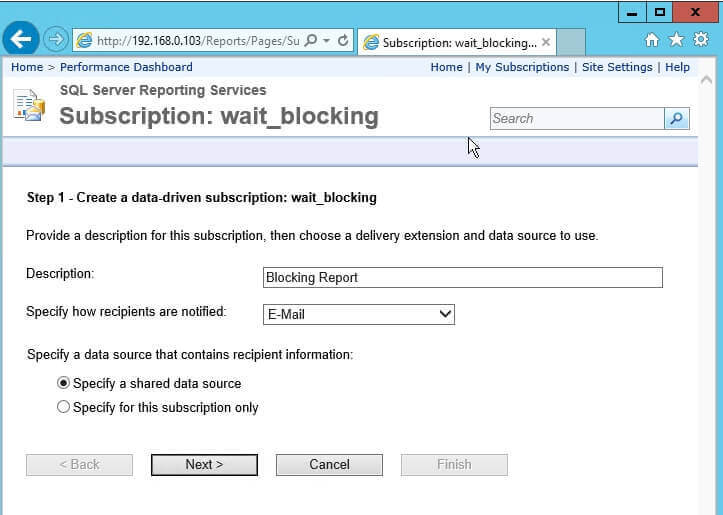
The first step of the wizard asks us for a description to easily identify the subscription and the delivery method i.e. E-Mail. Also this step will ask you for a data source that will be the source of information to trigger the report. Since we deployed all of the reports with a shared data source, it is wise to select that we will use that shared data source.
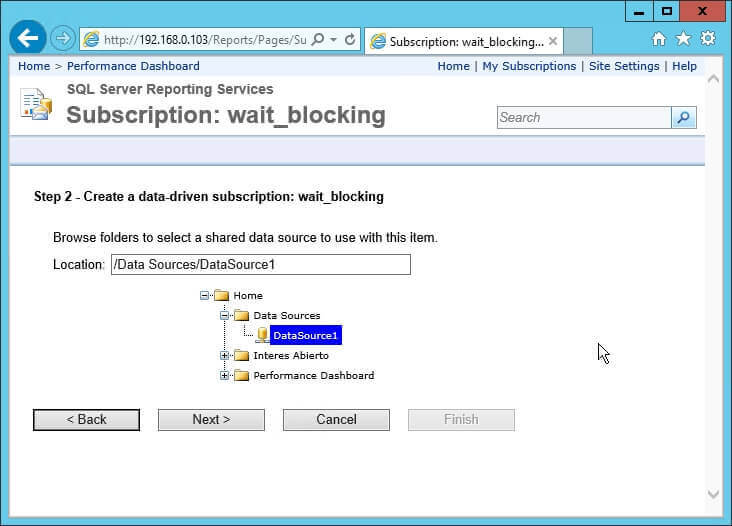
The second step asks us for that shared data source.
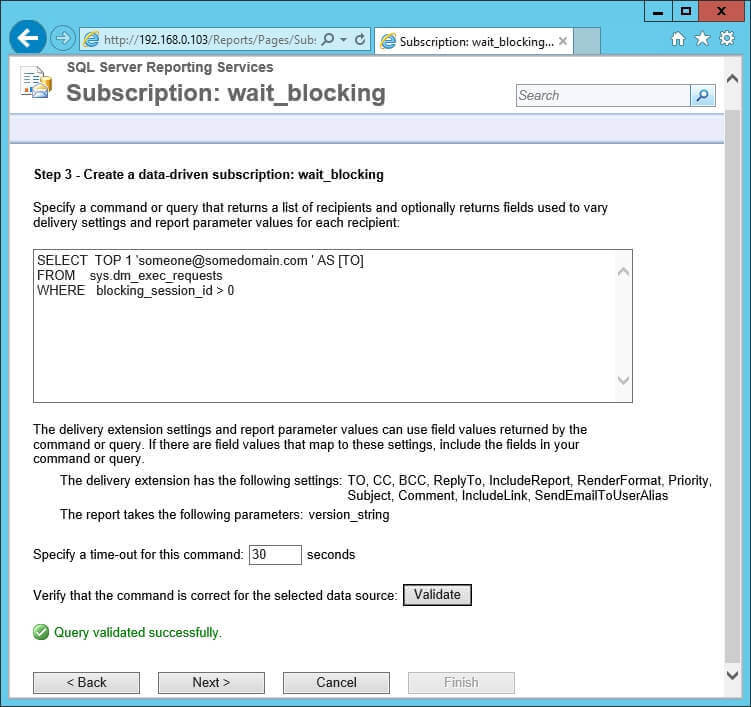
Step three is the most important to create a data driven subscription. Here is where we create a query that will trigger the report delivery. The wizard suggests a set of extensions that we can use to dynamically configure the report delivery that we can use in our query. For the blocking report we can use the following query to the sys.dm_exec_requests dynamic management view and look for values greater than zero in the column blocking_session_id. So, when there are rows that match this condition, the query returns a column named [TO] with the E-Mail address we are sending the report, otherwise the query does not return any value.
USE master
GO

SELECT  TOP 1 '[email protected] ' AS [TO]
FROM    sys.dm_exec_requests
WHERE   blocking_session_id > 0

GO
You can press the Validate button to check the query for errors and establish a command timeout.
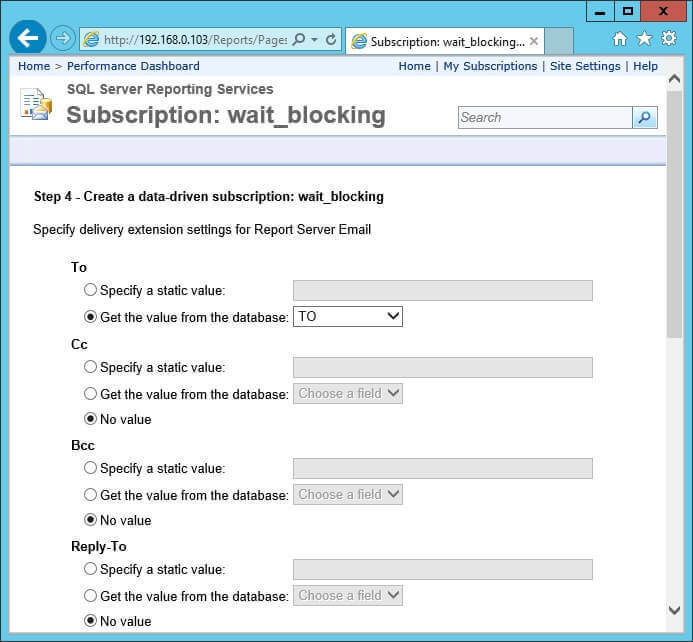
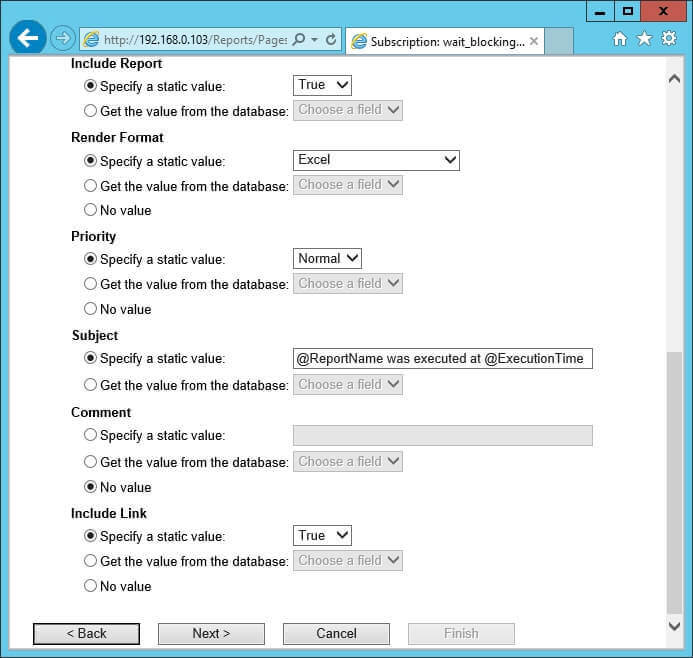
The next step of the wizard is to map the delivery extension settings with the values returned by our query and to assign static values to other settings that we consider constants. In this example I mapped the "To" delivery extension with the value from the query and set the Render Format with the static value "Excel" to receive the report as an attachment.
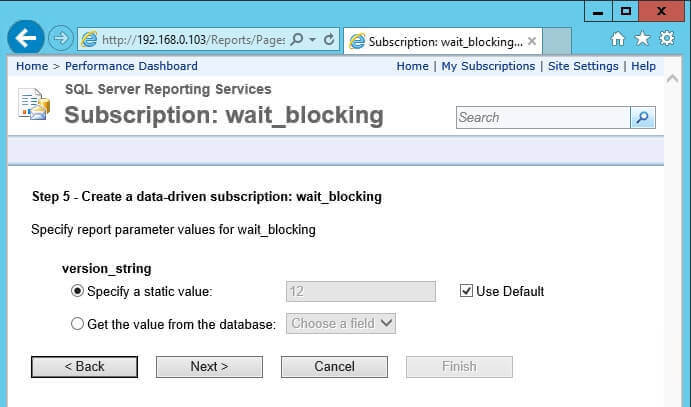
Step five asks us for a value for the version_string parameter. Due to the fact that when we deployed the report we configured the report to get the parameter value from the mayor_version field of the CHECK_DEPENDENCIES data set, we can set it to use the default value.
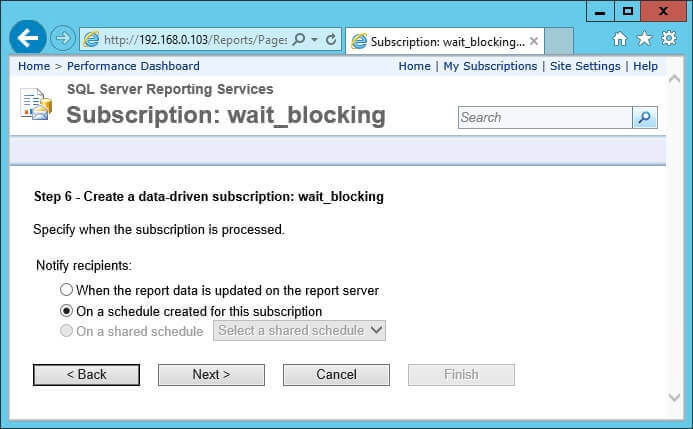
The sixth step lets us select when the subscription is going to be processed. I decided to use a new schedule, but you can use a shared schedule if you want. If you subscribe to other reports then maybe you will benefit from using a shared schedule.
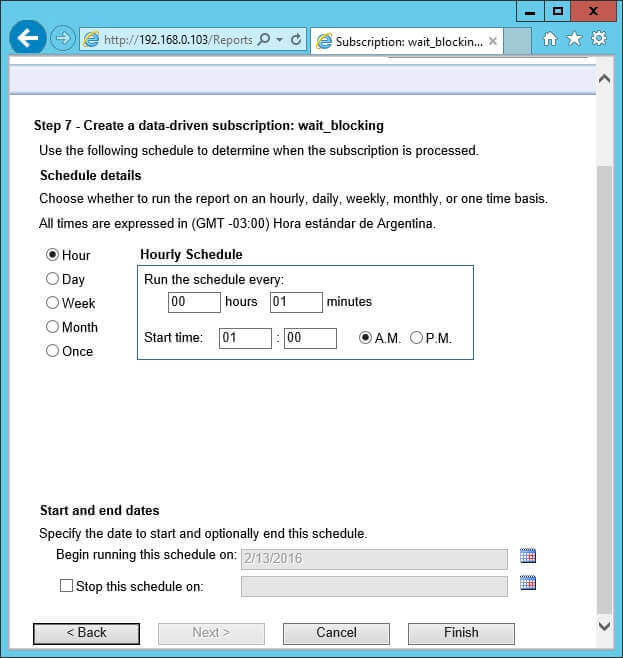
Finally the last step is to create the schedule. I configured the report to be executed every one minute, but you can change the time period as you need.
Next Steps
- If you are new to Performance Dashboard Reports, you can read my previous tip SQL Server Management Studio Performance Dashboard Reports Overview to get more information.
- Are you new to Reporting Services? This tutorial will be the best place to start: SQL Server Reporting Services Tutorial.
- Take a look at the enhancements for Reporting Services in SQL Server 2016: SQL Server Reporting Services 2016 Subscription Enhancements.
- Check out SQL Server Monitoring Tips category for more ideas about monitoring.
About the author
 Daniel Farina was born in Buenos Aires, Argentina. Self-educated, since childhood he showed a passion for learning.
This author pledges the content of this article is based on professional experience and not AI generated.
View all my tips


