Problem
How can I use the Power BI Q & A? What are some helpful tips for using it? Are there any limitations? What sort of visualizations are available? Can I pin the visualizations to dashboards?
Solution
One of the neat features that is available in the Power BI tool set is the Q & A feature. This feature matches our natural curiosity and questioning techniques with a powerful natural language query functionality. The Q & A function provides the method to ask questions of your data, and based on the words and language used get pertinent and appropriate data and visualizations. Power BI uses its powerful backend processing to pick out key words, select a dataset, and display a specific visualization based on its best guess for an appropriate visualization. This whole process is done on the fly and in real time; as you change your question, the selected data and visualization also change dynamically.
Power BI Q & A in Every Way
Power BI Q & A searches through all the datasets, reports, and visualizations on a selected workspace to come up with the best results to return. Thus, as you formulate your question, the answer will change as more and more details are typed. The Q & A is smart enough to change as you change what you are interested in querying. You can quickly adjust the direction of your questions and interact with the data. However, there are things we can do both in our dataset and dashboard design and when using the Q & A functionality to query the data. The behind the scenes work looks for patterns and key words that help in the selection of data points and visualizations and the process happens all rather quickly.
So let’s get started on using the Q & A functionality; of course there are some caveats and we will discuss those near the end of this tip. Furthermore, we will cover a few basic design techniques in this tip, but will follow up with a second tip on more advanced design methods and another tip on using the Cortana search functionality.
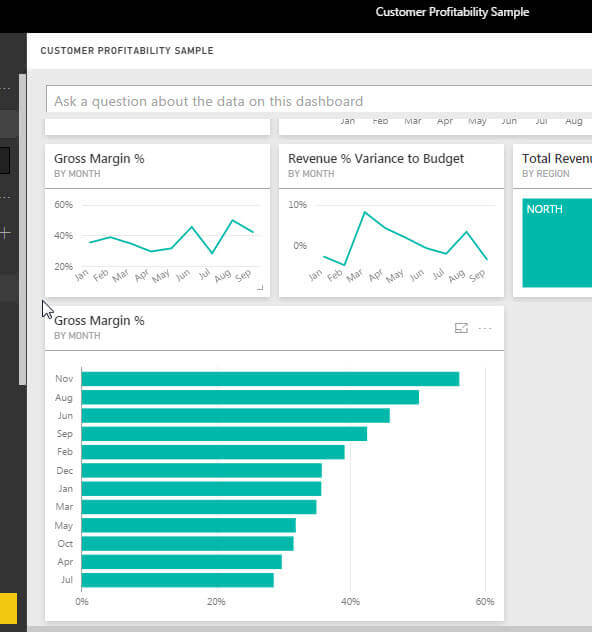
You will first need to login to Power BI, https://powerbi.microsoft.com/en-us/. Once you are logged into PowerBI, asking a question in the Q & A text box is as simple as starting to type. You, however must have an available dashboard and permissible dashboard selected. As shown below, I have the Customer Profitability dashboard selected and the Q & A textbox is readily available.

However, if you attempt to perform a Q & A on either report or datasets, you will see that you cannot complete a Q & A on each.


Additionally, you may notice some dashboards do not offer Q & A functionality. Several reasons cause this situation, but the most common reasons center around trying to Q & A a dataset where the data is not housed within Power BI. In the two below examples, the first is a direct query dataset while the second is a “shared” content pack which retrieves statistics directly from Bing. In both these cases, the data does not reside on Power BI, so unfortunately at this time, Q & A is not available.
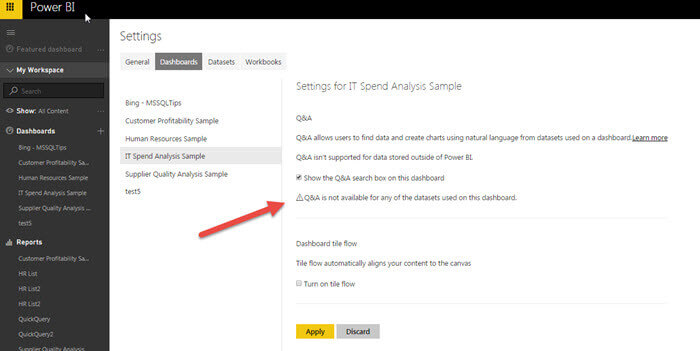

Furthermore, for those dashboards that are “eligible” to use Q & A, you can actually turn Q & A on and off, as displayed below.

Now using the Q & A is as simple as starting to formulate your question and begin typing. You will notice in the below screen print that as I typed gross margin, Power BI suggested “show gross margin”. You will also notice that Total Gross Margin shows as the suggested Card visualization. Finally, the source of the dataset shows at the bottom of the visualization.

In the next screen print, illustrated below, we added “show” as the beginning and added “by region” at the end. The visualization immediately changed to a column chart showing the gross margin by region.

However, if we type a question which lacks a matching element or pattern on our dashboard, we receive a warning message that an answer could not be found.

Alternately, suggested questions are presented, and you can simply click on one the suggestions to see the answer to that question.
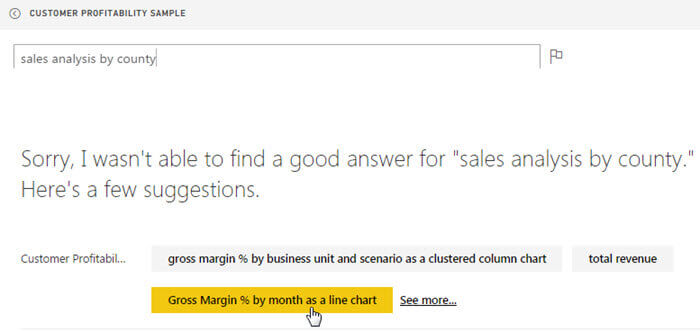
The results of this suggestion are shown below, and illustrate another excellent point about the question process. We not only can suggest what data we would like to see, but also can reference a specific visualization in our question, a line chart in the below example.
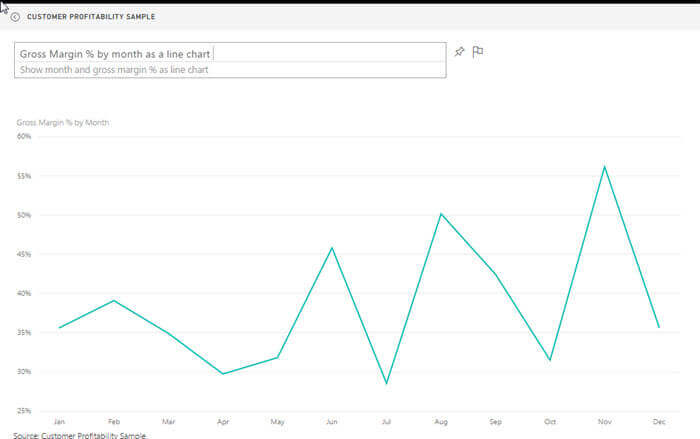
We could easily switch the line chart to a column chart. Furthermore, we can pin our new visual, based on the question we asked, to a dashboard by clicking on the Pin Visual button.

We are now given the option to add the visualization to either an existing dashboard or to create a new dashboard. If we select the existing dashboard, then we can select the dashboard where the new visual will get saved.
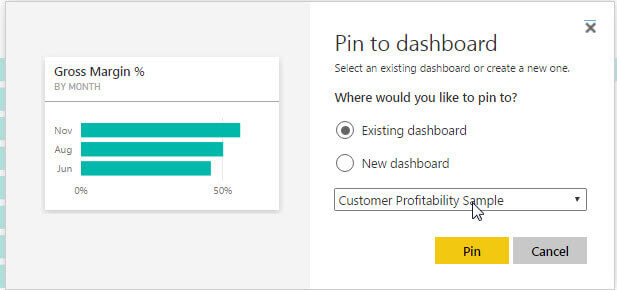
In the above example, we selected to add the visual to an existing dashboard, with the final result shown below.
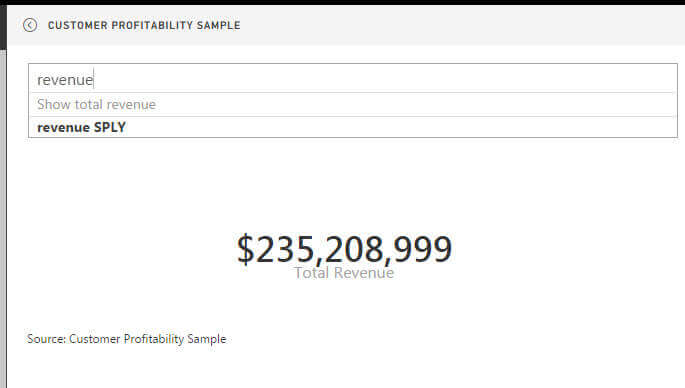
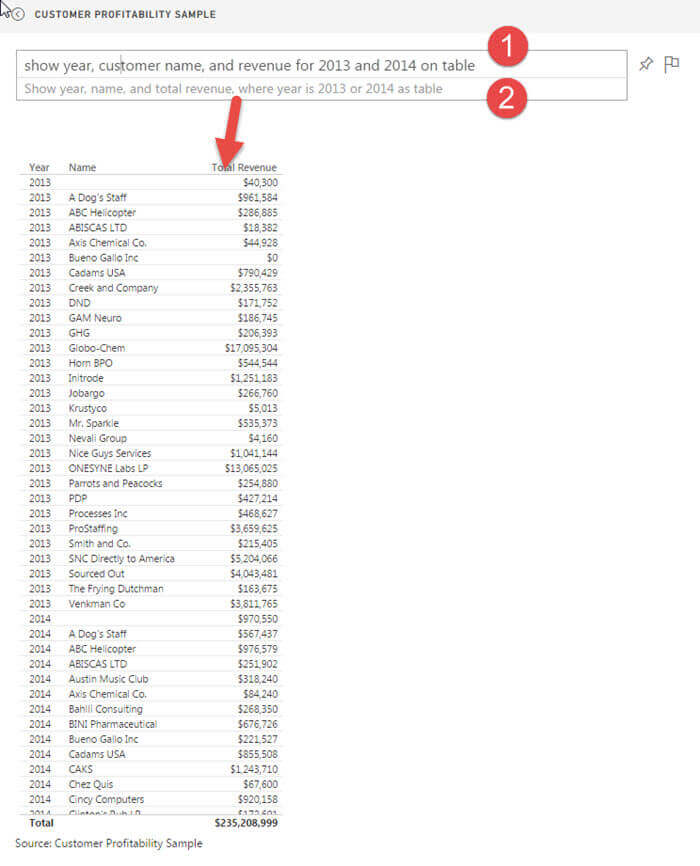
Now that we have many of the basics defined, we can discuss some of the more advanced ways to use the Q & A function. One of best ways to get answers that are correct in both result and in presentation is to select the words in the questions very specifically. For instance instead of using only “revenue”, we should type “show year, customer name, and revenue for 2013 and 2014 on table”. As you can see in the below screen prints, the first question of just “revenue” provides just a total revenue Card visualization, but in the second screen print we use words to describe what I want to show along with a criteria and finally a visualization. We subsequently get the specific results we are looking for. Also notice in the second screen print, that Power BI “rephrases” your question in the standard format; it changed the “for 2013 and 2014” to “where year is 2013 or 2014” and “on table” to “as table”. It is a good idea to pay attention to these suggestions and adjust your question format to match those key words in the future.
To write questions that will return accurate results, we would want to do several of the following:
- Use the word “show” and then tell the question the specific column names that you would want returned. Of course knowing the dataset helps to know the appropriate names to use. For these items, you can also use aggregation suggestions such as total, average, number of, or count. (see first screen print below)
- Use the word “where” and then tell Power BI the column name and what criteria you would like to return. Alternately, you can use key words such as: “is”, “between”, “for”, or “equals”.
- Use the word “as” and then a visualization type to tell Power BI what visualization you would like the data displayed on.
- Use the words “sorted by” plus a field to tell Power BI how you want the results sorted. Note, many of the visualizations also give you the ability to sort within the visualization itself. (see second screen print below)
- For date oriented fields, use key words such as “this month”, “before”, “after”, or “last year”.


Power BI is also smart enough to correct spelling errors, as illustrated below. The word “revenue” intentionally has an extra “w” added to the end of the word; Power BI corrected it to revenue. You will also notice I added the word “balloon” to the question; although it is a bit hard to see in the screen print, that word is grayed out. Power BI dims a word when it cannot find a correlation or matching pattern in the dataset and thus ignores that word.

We have discussed many ways to make your questions in Power BI better, but on the design side there are also some basic items that help to make the questions better. These items include
- Use accurate and descriptive names (for all objects!).
- Make sure your data types are correct, especially for the normal culprits such as dates and those pesky values that look like numbers, but really are not.
- Turn off aggregation for those fields that are numbers, but do not need to be summarized (month numbers for instance).
- Each table and field should cover just one entity and attribute item (normalization).
These items are just the start for designing a good dashboard for Q & A. My next tip will cover more advanced methods of designing your Q & A strategy including using default fields and labs, adding synonyms, designing default questions, and using advanced phrasing techniques.
Conclusion
The Q & A functionality in Power BI is quite a feature for end users. It makes addressing specific questions about the data easy to ask and easy to see results. The functionality analyzes your natural / normal question and behind the scenes returns data based on the question and use its best guess of the appropriate visualization to display the results. You can also specify the type of visualization you would like returned. Furthermore, as you type your question, Power BI interactively returns the resulting visualization while changing the results as you type. All at the same time, it offers suggested, auto completed questions that can also be selected. As you work with the Q & A functionality more and more, you will see certain patterns of words that are helpful to use in your questions. Phrases such as between, show, and sorted by, act as key word qualifiers for Power BI to use for filtering and formatting the results.
Next Steps
- Compare Power BI Desktop and Power BI Online.
- Check out all of the Power BI tips.

I have a passion for crafting Business Intelligence Solutions for my user groups. My experience includes almost 15 years of SQL Server involvement with the last 12 years focused specifically on Business Intelligence, SharePoint, OLAP, SSRS, and Decision Support solutions. Currently, I am a Business Intelligence Architect in the healthcare industry, and I also teach database and analytics classes for Kennesaw State University, Southern New Hampshire University, and Reinhardt University. My education includes an MBA and an undergraduate in Accounting (yes I am a reformed accountant!), both from Kennesaw State University. I enjoy every day by trying to grow my faith and spend precious time with my family. I have been happily married to my wife of over 20 years, and we have two teenagers one who we home school with the help of a University Model School, Cornerstone Prep in Acworth, GA (cornerstoneprep.org). Our other child is a Construction Management major at KSU’s Southern Poly / Marietta campus. We are a soccer and Cross Country (XC) family who play, coach, and referee soccer or run for fun most every day. For several years, our family has volunteered (and played with the dogs and cats) at Etowah Valley Humane Society in Cartersville, GA.
- MSSQLTips Awards: Champion (100+tips) – 2016 | Author of the Year – 2015 | Author Contender – 2014, 2016-2021


