By: Ahmad Yaseen | Comments | Related: > SQL Server Configurations
Problem
Recently we received complaints from the Information System team that there was slowness in a specific page of our web site. After checking with the development team they replied that the page opens DTC transactions with SQL Server to process its data. We looked at SQL Server and checked the MS DTC transactions, a few transactions we found were opened for a long time, but we were unable to identify which system was issuing these transactions and which of these transactions was causing the slowness issue. How can we find the MS DTC transactions related to poor query performance?
Solution
Microsoft SQL Distributed Transaction Coordinator (MS DTC) is a transaction manager that manages the committing process of distributed transactions across all SQL Servers used by these transactions. In this way, DTC will guarantee that the distributed transaction will succeed as one component if all the transaction parts complete successfully or rolled back as one component if any part of the transaction fails.
SQL Server distributed transactions that connect to one or more remote databases can be monitored using the MS DTC console, from where you can find a list of all distributed transactions that are currently running on SQL Server. But as a DBA, in order to trace a transaction that is running for a long time or a transaction that is causing an issue, we need the details about these transactions in order to provide information to the related system owner.
To manage MSDTC, you need to open Component Services by typing dcomcnfg in the RUN dialog box on your server. Then inside the Component Services, browse to Computers -> My Computer -> Distributed Transaction Coordinator -> Local DTC (or Clustered DTC if the server is a part of windows cluster), then go to the Transaction List.
The only available information in this page is the distributed transaction status and the Unit of Work ID for that transaction. This information is not enough to trace the transaction that is causing an issue in the system. What is missing is a way to map this information back to SQL Server in order to get the transaction details.
To achieve this, the sys.dm_tran_locks system DMV can be used to map the Unit of Work ID (UoW) derived from the MS DTC console with the DMV’s request_owner_guid value for that transaction to get the transaction’s session ID under which its queries are running. Joining that DMV with the sys.sysprocesses system table, we can get more information about that session in addition to the query handle for that transaction, which can be passed as a parameter to the sys.dm_exec_sql_text in order to get the full query text.
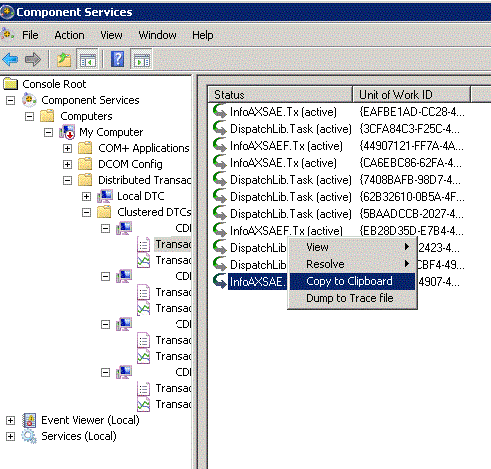
The UoW can be copied from MSDTC by right-clicking on the transaction that you need to check and choosing Copy to Clipboard as shown below:

Here is the query we will use with the UoW value taken from MSDTC to get the distributed transaction’s information:
Use master
GO
SELECT
  DISTINCT(request_owner_guid) as UoW_Guid,
  request_session_id,
  DB_NAME (SYP.dbid),
  SYP.loginame,
  SYP.hostname,
  SYP.status,
  SYP.program_name,
  (select text from sys.dm_exec_sql_text(SYP.sql_handle)) as QueryText,
  syp.lastwaittype,
  SYP.cpu,
  SYP.memusage,
  SYP.physical_io
FROM sys.dm_tran_locks DTL
JOIN sys.sysprocesses SYP
  ON DTL.request_session_id=SYP.spid
WHERE request_owner_guid ='{5190C691-A6A7-4642-A842-CB77E1DEFD19}'
GO
Where the request_owner_guid value is the UoW value copied from MSDTC. The result will be like this:

The same query can be re-written to get all MSDTC transactions connected to SQL Server as shown below:
USE master
GO
SELECT
  DISTINCT(request_owner_guid) as UoW_Guid,
  request_session_id,
  DB_NAME (SYP.dbid),
  SYP.loginame,
  SYP.hostname,
  SYP.status,
  SYP.program_name,
  (select text from sys.dm_exec_sql_text(SYP.sql_handle)) as QueryText,
  syp.lastwaittype,
  SYP.cpu,
  SYP.memusage,
  SYP.physical_io
FROM sys.dm_tran_locks DTL
JOIN sys.sysprocesses SYP
  ON DTL.request_session_id=SYP.spid
WHERE request_owner_guid <>'00000000-0000-0000-0000-000000000000'
GO
As you can see, with one query you can get information about all of the currently running distributed transactions, such as the database name, login name, host name, query status, query text, wait type and how many resources are being consumed by the query. And now, the incomprehensible data displayed in the MS DTC console can be translated to information we can use in our investigation and performance tuning process.
Next Steps
- Read more about Troubleshooting SQL Server Distributed Transactions.
- Check out How to Kill a Blocking Negative SPID in SQL Server.
About the author
 Ahmad Yaseen is a SQL Server DBA with a bachelor’s degree in computer engineering as well as .NET development experience.
This author pledges the content of this article is based on professional experience and not AI generated.
View all my tips


