By: Ben Snaidero | Comments | Related: > Database Configurations
Problem
Every SQL Server DBA at one point or another has had to deal with IO spiking issues. It might be old hardware that can't handle these spikes or running in the cloud where you have an IOPS limit. You could also be running in a VM environment where IO spikes can cause issues with other servers. Whatever the reason might be, this tip will look at one method you can use which can help to reduce the occurrences of these spikes and smooth out the IO requests on your disk subsystem.
Solution
In a SQL Server environment most of the database IO will happen when a checkpoint occurs and all of the dirty buffers in the cache are flushed to disk. In the past our only option for changing the frequency of checkpoints was changing the "recovery interval" server configuration option which changed this interval for the entire server. What if it was only one database that was causing IO spikes.
Since SQL Server 2012 we have had the indirect checkpoint feature which allows us to control the recovery time (and therefore checkpoint frequency) at the database level.
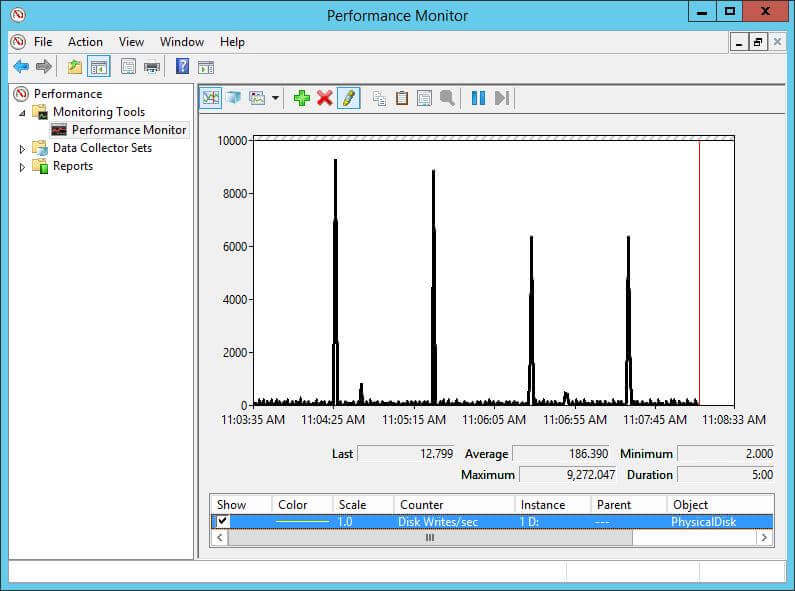
By default in SQL Server 2016 the TARGET_RECOVERY_TIME is set to 60 seconds (previous versions the default was 0), so let's first take a look at what our disk performance looks like with this default setting. We will use Windows Performance Monitor and the "Disk Writes/sec" counter in order to measure our performance. Below is a screenshot of the performance of our SQL Server instance with the default settings.

You can see from the screenshot above that we see a big IO spike every minute when the checkpoint occurs.
Adjusting Target Recovery Time
Now let's reduce the TARGET_RECOVERY_TIME to 15 seconds which will have the side effect of increasing the frequency of checkpoints on the database where we are seeing the IO spikes. Here is the TSQL to change this setting.
ALTER DATABASE iotest SET TARGET_RECOVERY_TIME = 15 SECONDS;
You can also use the following query to verify this setting for all of the databases in your SQL Server instance.
SELECT name,target_recovery_time_in_seconds FROM sys.databases;
Here are the results:
name         target_recovery_time_in_seconds
------------ -------------------------------
master       0
tempdb       60
model        60
msdb         60
iotest       15
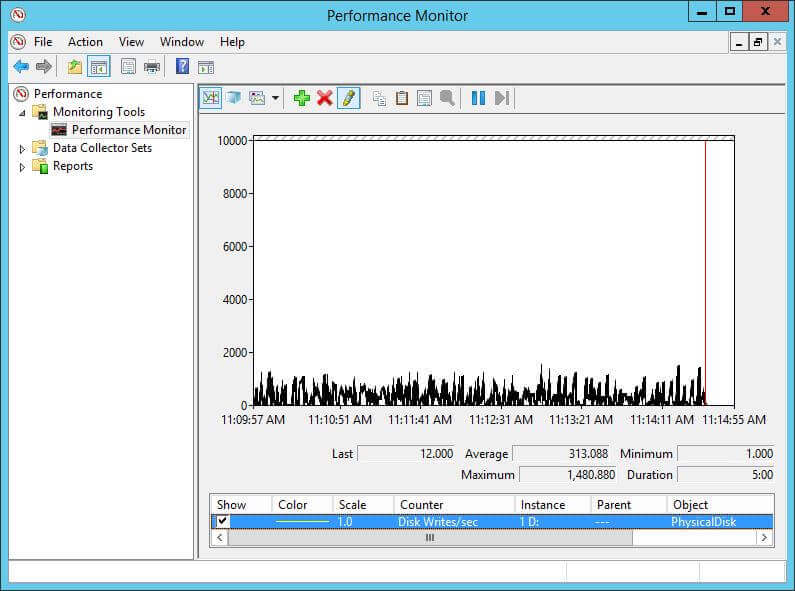
After updating this setting let's check our performance again using Windows Performance Monitor.

You can see from this snapshot that we no longer have the large spikes in IO every minute. Notice though that the average number of disk write per second has gone up. This can be attributed to the fact that we probably end up writing the same buffer to disk multiple times over the course of a minute whereas this same buffer was only flushed to disk once with the default setting. You can test with different values for TARGET_RECOVERY_TIME to see what works best for your environment to try to balance out this average and maximum.
Next Steps
- Read more checkpoints
- Read other tips on using Windows Performance Monitor
About the author
 Ben Snaidero has been a SQL Server and Oracle DBA for over 10 years and focuses on performance tuning.
This author pledges the content of this article is based on professional experience and not AI generated.
View all my tips


