Problem
With the 2016 release of SQL Server Microsoft has decided to expand SQL Server to run on Linux servers. Since most SQL Server DBA’s are not used to working with Linux, there are common tasks like checking for free disk space or CPU consumption that may be difficult. In this tip I will make a short list of what we need to know about Linux administration to start using SQL Server on Linux.
Solution
Here we will cover some of the key things you shown know.
TOP command
The most basic console command to check CPU consumption is top. The output of this command consists of a header that shows general information and a grid with the information per process. Take a look at the next screen capture.
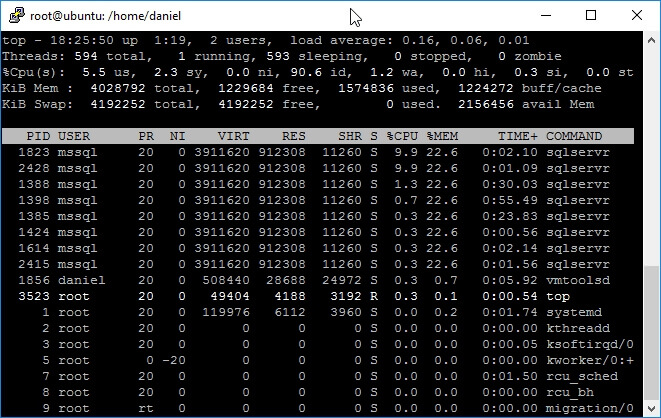
For those of us used to Windows, it is important to understand what each line means, so I will go line by line describing its meaning.
Line 1
- Current system time
- Time since the system was powered on
- Number of logged on users
- Load Average measured at intervals of 5, 10 and 15 minutes
On Linux systems the Load Average measures the percentage queued tasks (either CPU or IO) over a specific timeframe. This value also depends on the number of CPU cores. For example, a system with one core with a load average of 1 has a full load, but if the system has two cores it has a half load. As a rule of thumb, if the load average is a number greater than the number of cores of your system it means that your system is under stress. Keep in mind that the load average could be a number far greater than the number of cores on your system due to waiting tasks.
Line 2
- Number of total Tasks
- Number of tasks actually running
- Number of processes waiting for an event to continue execution
- Number of stopped tasks
- Number of processes in zombie state
Here we need to explain what a zombie process is. On a Linux system, when a child process finishes it keeps the process id on the processes table, so the parent process can read the child process exit status. That finished child process is called a zombie. After the parent process reads the child exit status the zombie is removed. The problem with zombies is that Linux has a limited number of process ids (which you can find by reading the file /proc/sys/kernel/pid_max) and in very rare circumstances this may lead to a lack of resources.
Line 3
This line shows information regarding CPU time usage.
- Percentage CPU Time in User Mode
- Percentage CPU Time in System Mode
- Percentage CPU Time in Low Priority User Mode (Linux calls it Nice Priority)
- Percentage CPU Idle Time
- Percentage CPU Time Waiting for I/O
- Percentage CPU Time Servicing Hardware Interrupts
- Percentage CPU Time Servicing Software Interrupts
- Percentage CPU Time Virtual CPU waits for a real CPU while the hypervisor is servicing another virtual processor (This is called Stolen Time)
Line 4
This line gives us information about our system’s physical memory.
- Total Memory
- Free Memory
- Used Memory
- Memory used by Buffer Cache
Line 5
This line shows information about the swap partitions, the equivalent to Windows pagefile.
- Total Swap partitions space.
- Free Swap partitions space.
- Used Swap space.
- Available Physical Memory.
Process Grid
The lower panel of the top command displays a grid with information regarding running processes.
Column | Description |
|---|---|
PID | The Process Identifier |
USER | User who owns the Process |
PR | Process Priority. If you see RT on this column that means the process |
NI | Nice Priority. If it is a negative value that means the process is |
VIRT | Amount of Virtual Memory used by the process expressed in kilobytes. |
RES | Amount of Physical Memory used by the process expressed in kilobytes. |
SHR | Amount of Shared Memory expressed in kilobytes. |
S | Process status |
%CPU | The percentage usage of CPU by the given task. If you see a number |
%MEM | The percentage of Physical Memory used by the process. |
TIME+ | Amount of CPU Time used by the process. |
COMMAND | The command who started the process. |
HTOP as an alternative
There is an alternative to top which is a Linux monitoring tool called htop (http://hisham.hm/htop/). The advantage of this tool is that it uses color and shows information about CPU, Memory and Swap as graphic bars.

Usually this tool is not available on base Linux installations, so you will have to install it from your distribution repositories or downloading the packages from the htop website.
If you are using Ubuntu, the following command will install htop.
sudo apt-get install htop
Next Steps
- Check out SQL Server 2016 tips.
- Learn how to install SQL Server vNext on Mac: Run SQL Server vNext (CTP1) as a Docker Container on a Mac.
- Stay tuned for more SQL Server on Linux Tips.

Daniel Farina was born in Buenos Aires, Argentina. Self-educated, since childhood he showed a passion for learning. He studied at Universidad de Buenos Aires. Daniel started working as a programmer at a young age. Over the years he specialized in databases, particularly SQL Server and Oracle. Now with 30 years of age, his work experience includes working with various technologies like VB, C, .NET, web development, Windows and Linux systems. He likes to read about science, psychology, philosophy and many other things. In his spare time, he trains powerlifting aiming to compete.
- MSSQLTips Awards: Author of the Year – 2018 | Champion (100+ tips) – 2018 | Author Contender – 2015-2017, 2019
