Problem
With the upcoming release of SQL Server, Microsoft has decided to expand operating system support to Linux servers. We as Database Administrators need to know how the underlying disks subsystems are performing. Since most of the SQL Server Administrators are not used to work with Linux, you may not know how to do this task. In this tip I will show you some tools that will help you.
Solution
One of the duties of a Database Administrator is to ensure that the storage subsystem that supports our databases is performing properly. Of course, we have the I/O Related Dynamic Management Views and Functions like sys.dm_io_pending_io_requests and sys.dm_io_virtual_file_stats, but sometimes that is not enough. In fact, we are used to looking at disk related performance counters on servers running on Windows and even use other tools like the one explained by Ben Snaidero in the following tip: Gather Storage Subsystem Performance Metrics Using the Diskspd Utility for SQL Server Applications.
Available Linux Tools
Now that SQL Server also runs on Linux we must get familiar with the existing tools that will allow us to do our work just like we do on Windows.
iostat
This is the most basic command to check for disk I/O and you will generally have it installed by default, but if not you can install the sysstat package that includes the iostat tool.
apt-get install sysstat
Basically this command shows CPU and I/O statistics for devices and partitions as two separate reports, but with arguments -c and -d you can force it to only display either the CPU or the devices report respectively. For the purposes of this tip, I will focus the attention to the I/O report.

As you can see on the previous image the command shows a table with one row for each installed device and four columns that informs us about the Transfer per Second (tps), reads and writes per second expressed in kilobytes and the amount of kilobytes read and written.
By now we have seen a static picture of our I/O performance, but this command also allows us to keep it running at a specified interval of time (in seconds). When we run iostat with an interval it changes its behavior, and for every run it will show us the delta of reads and writes from the previous execution. The following command shows every four seconds the device usage report until Control + C is pressed.
iostat -d 4
On the following screen capture is the output of the previous command execution.

But this tool has already more features. When iostat is executed with the -x parameter it returns extended statistics. The most helpful statistics are in the columns avgqu-sz, which is the average queue length; and a wait that refers to the time spent queuing and servicing a request. Below are two screen captures with the output of this command.
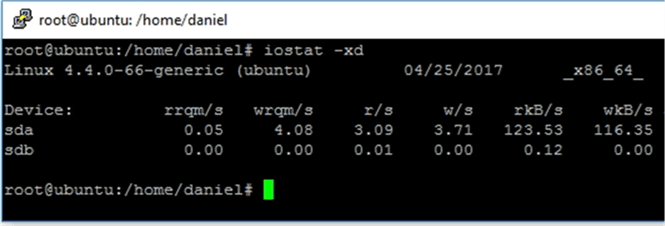

On the next table I copied the man page description of each column from the pictures.
Column | Description |
|---|---|
rrqm/s | The number of read requests merged per second that were queued to the device. |
wrqm/s | The number of write requests merged per second that were queued to the device. |
r/s | The number of read requests that were issued to the device per second. |
w/s | The number of write requests that were issued to the device per second. |
rkB/s | The number of kilobytes read from the device per second. |
wkB/s | The number of kilobytes written to the device per second. |
avgrq-sz | The average size (in sectors) of the requests that were issued to the device. |
avgqu-sz | The average queue length of the requests that were issued to the device. |
await | The average time (in milliseconds) for I/O requests issued to the device to be served. This includes the time spent by the requests in queue and the time spent servicing them. |
r_await | The average time (in milliseconds) for read requests issued to the device to be served. This includes the time spent by the requests in queue and the time spent servicing them. |
w_await | The average time (in milliseconds) for write requests issued to the device to be served. This includes the time spent by the requests in queue and the time spent servicing them. |
svctm | The average service time (in milliseconds) for I/O requests that were issued to the device. Warning! Do not trust this field any more. This field will be removed in a future sysstat version. |
%util | Percentage of CPU time during which I/O requests were issued to the device (bandwidth utilization for the device). Device saturation occurs when this value is close to 100%. |
iotop
This utility displays the I/O usage per process or threads on an interactive grid that resembles the htop utility.

As you can see on the previous image, this utility shows the threads or processes (I will show you how to change amongst the two shortly when I outline its arguments). Most of the columns are self-explanatory, just to mention that the IO column lists the total I/O for each process including disk use and swap; and SwapIn lists the swap activity for each process.
Following is a table with the most used parameters.
Parameter | Description |
|---|---|
-o | Only show processes or threads actually doing I/O, instead of showing all processes or threads. This can be dynamically toggled by pressing o. |
-b | Turn on non-interactive mode (batch mode). Useful for logging I/O usage over time. |
-P | Only show processes. Normally iotop shows all threads. |
-a | Show accumulated I/O instead of bandwidth. In this mode, iotop shows the amount of I/O processes have done since iotop started. |
But being iotop an interactive utility, there are some keyboard shortcuts that are helpful.
Key | Description |
|---|---|
left and right arrows | Changes the sorting column. |
r | Reverses the sorting order. |
o | Shows only processes or threads actually doing I/O. |
p | Show processes instead of threads. |
a | Display accumulated I/O instead of bandwidth. |
i | Changes the priority of a thread or process. |
Next Steps
- In the following tip you will get an insight about SQL Server on Linux: Getting Started with SQL Server on Linux.
- If you need help to find out CPU consumption on Linux, take a look at my previous tip on this series of articles about Linux administration for SQL Server DBA’s: Linux Administration for SQL Server DBA’s: Checking CPU Usage.
- Read my previous tip about checking disk space on Linux: Linux Administration for SQL Server DBA’s: Checking Disk Space.
- Check out more SQL Server 2016 tips.
- Stay tuned for more SQL Server on Linux Tips.

Daniel Farina was born in Buenos Aires, Argentina. Self-educated, since childhood he showed a passion for learning. He studied at Universidad de Buenos Aires. Daniel started working as a programmer at a young age. Over the years he specialized in databases, particularly SQL Server and Oracle. Now with 30 years of age, his work experience includes working with various technologies like VB, C, .NET, web development, Windows and Linux systems. He likes to read about science, psychology, philosophy and many other things. In his spare time, he trains powerlifting aiming to compete.
- MSSQLTips Awards: Author of the Year – 2018 | Champion (100+ tips) – 2018 | Author Contender – 2015-2017, 2019
