Problem
We collect various performance counters on our SQL Servers and currently we rely on SQL Server Reporting Services (SSRS) or Excel to visualize the collected data, which usually means lots of overhead work. I heard that R is a pretty good tool for visualizing data and in SQL Server 2016, R scripts can be embedded into T-SQL. I want to see if I can display performance counter graphs with pure T-SQL and embedded R.
Solution
The R language is very useful in plotting various graphs and with R integration in SQL Server 2016 it is pretty straight forward to do the work.
In this tip, we will walk through a whole solution that can be used in our daily DBA work.
To visualize performance counter data, we have three key tasks:
- Install R plotting package [ggplot2]
- Set up a performance counter collection and save the results to a SQL Server database
- Develop R code and embed into T-SQL to generate the desired graph and save it to a file
- (optional) Email the file to required recipients
Setup Performance Counter Collection Set
Basically, there are three steps to setup the Performance Counter Collection Set.
- First create a DSN via odbcad32.exe, the key here is to use the “SQL Server” driver during the configuration and do not use any other driver as shown below. In my case, my DSN [PerfC3] points to database [TestDB] on my server [localhost\sql2016].

- Second create a Performance Collection Set using Performance Monitor (run perfmon.msc from a command line), in my test case I create two performance counters, [%processor time] and [Avg Sec/Read] as shown below.

- Start the Performance Collection Set. We should now see three new tables in [TestDB] and they are populated as shown below. For details of the three tables, we can check this MSDN document.

Install R Plotting Package
We will assume SQL Server R services (in-database) is already installed and we just need to add the additional plotting package [ggplot2].
The detailed installation steps are outlined here.
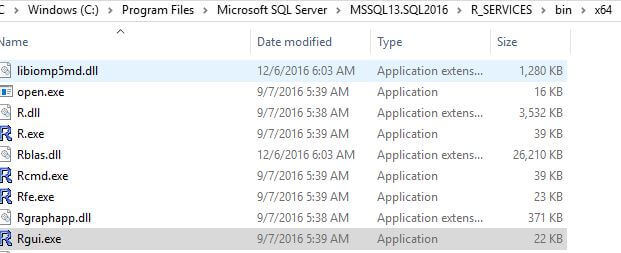
On my computer, I ran RGUI.exe as an administrator. RGUI.exe is located at C:\Program Files\Microsoft SQL Server\MSSQL13.SQL2016\R_SERVICES\bin\x64, because my SQL Server 2016 is a named instance (i.e. sql2016) as shown below.
The installation is simple by just running one command (note an internet connection should be available during installation).
install.packages("ggplot2")

Plotting a Graph with R
To plot code from data stored in a SQL Server table, we need to first fetch the data set we need and then pass the data set to the ggplot function to plot the graph.
For the required data set, we actually only need two columns from the dbo.CounterData table as shown below.
USE TestDB
select d.CounterDateTime, d.CounterValue
from dbo.CounterData d
inner join dbo.CounterDetails c
on c.CounterID = d.CounterID
and c.CounterName = '% Processor Time' -- 'Avg. Disk sec/Read'
GO
An item to note, [CounterDateTime] in dbo.CounterData table is of datatype char(24) as shown below. As such, we need to convert it to datetime to be able to plot it with R, otherwise we cannot plot the data correctly.

The correct data fetch script is as follows:
USE TestDB
GO
select [Time]=convert(datetime, substring(d.CounterDateTime,1,23))
, [Value]d.CounterValue
from dbo.CounterData d
inner join dbo.CounterDetails c
on c.CounterID = d.CounterID
and c.CounterName = '% Processor Time' -- 'Avg. Disk sec/Read'
GO
We can easily modify the script by adding a WHERE clause to meet different monitoring requirements. Some examples can be:
- Plot the last 1 hour of performance counter values in a graph
- Plot the performance counter value from time [X] hh:mm:ss to time [Y] HH:MM:SS
- If [% Process Time] is above a specified threshold for the last 5 minutes, alert me with a graph of the values for the past.
- If in the past one hour window, there are 3 occurrences where the CPU goes beyond 95%, alert me with a graph of the CPU performance over the last one hour.
We can come up with whatever monitoring we want and then plot the necessary graph for a better and more vivid examination.
The following T-SQL code shows how to plot the two performance counters we have collected over the past 1 hour and then email the graph. It will generate two graphs in two pdf files under the c:\perf_graph\ folder.
use TestDB
/*
-- We can put some conditions here to decide whether we want to plot
-- for example, if the past 10 min CPU is above a threshold (say 95%), we will
-- plot the graph for the past hour
if (
select avg(CounterValue)
from dbo.CounterData
where convert(datetime, substring(CounterDateTime,1,23)) > dateadd(minute, -5, getdate()) ) >= 95.0
begin
-- move the following code into this
end
*/
-- 1. get CPU performance counter
EXEC sp_execute_external_script
@language = N'R'
, @script = N'
library(ggplot2);
ggplot(rslt, aes(x = Time, y = Value)) +
geom_line() + ggtitle("% Processor Time") +
ggsave(pth);
'
, @input_data_1 = N'
select [Time]=convert(datetime, substring(d.CounterDateTime,1,23)),
[Value]=d.CounterValue
from dbo.CounterData d
inner join dbo.CounterDetails c
on c.CounterID = d.CounterID and
c.CounterName = ''% Processor Time''
and convert(datetime, substring(d.CounterDateTime,1,23)) > dateadd(minute, -60, getdate()); '
, @input_data_1_name = N'rslt'
, @params = N'@pth varchar(128)'
, @pth = N'c:/perf_graph/cpu_perf.pdf'; -- file path
-- 2. plot Avg. Disk Sec/Read graph
EXEC sp_execute_external_script
@language = N'R'
, @script = N'
library(ggplot2);
ggplot(rslt, aes(x = Time, y = Value)) +
geom_line() + ggtitle("Avg Disk Sec/Read") +
ggsave(pth);
'
, @input_data_1 = N'
select [Time]=convert(datetime, substring(d.CounterDateTime,1,23)),
[Value]=d.CounterValue
from dbo.CounterData d
inner join dbo.CounterDetails c
on c.CounterID = d.CounterID and
c.CounterName = ''Avg. Disk sec/Read''
and convert(datetime, substring(d.CounterDateTime,1,23)) > dateadd(minute, -60, getdate()); '
, @input_data_1_name = N'rslt'
, @params = N'@pth varchar(128)'
, @pth = N'c:/perf_graph/disk_perf.pdf'; -- file path, using forward slash / instead of backward slash go
-- 3. send out email, assuming the database email is set up correctly
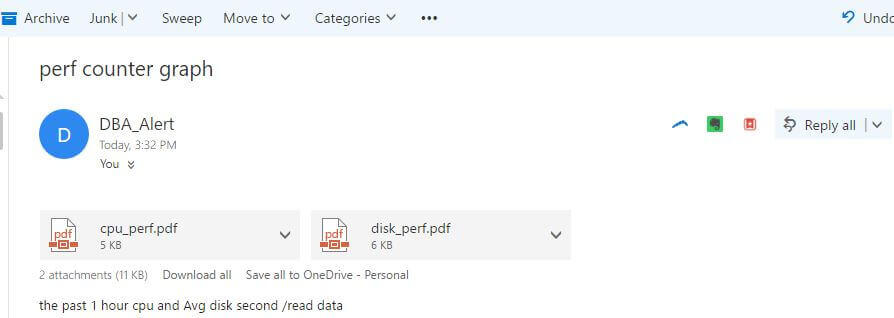
exec msdb.dbo.sp_send_dbmail @recipients = '[put your email address here]' -- put your own email address here
, @subject='perf counter graph'
, @body = 'the past 1 hour cpu and Avg disk second /read data'
, @file_attachments = N'c:\perf_graph\cpu_perf.pdf;c:\perf_graph\disk_perf.pdf'; -- no space before/after semi colon
After running the script in my SSMS window, I will get an email like the following.
If we open each attached pdf file, we can see the following two graphs.


Summary
In this tip, we demonstrated how to use R to visualize collected performance counter data. This method enriches our DBA’s monitoring capability, and in fact we can plot better and fancier graphs with R’s ggplot2 package instead of my presented black and white graphs in this tip. But visualizing data with R in itself is a big topic and beyond the scope of this tip.
Next Steps
Collect your performance counter data and put the data into a SQL Server 2016 database, then use R on this SQL Server 2016 instance and generate the needed reports.
You can further tune the graph, like plotting different types with different colors.
Refer to the following resources for additional information:
- Collecting Performance Data into a SQL Server Table
- SQL Server sp_execute_external_script Stored Procedure Examples
- SQL Server 2016 R Services: Executing R code in SQL Server
- SQL Server 2016 R Services: Display R plots in Reporting Services
- Basic introduction to ggplot2
- Cookbook for R
- Check out these tips on SQL Server Database Mail

Jeffrey Yao is a senior SQL Server consultant with 15 years of database administration, his current interests are on database administration automation and visualization. He enjoys reading the concise and smart sql tips and loves R&D work in DBA Engineering topics. His blog is at: http://www.sqlservercentral.com/blogs/jeffrey_yao/.