By: Daniel Farina | Comments (1) | Related: > Log Shipping
Problem
With the release of SQL Server 2017, Microsoft now offers SQL Server on Linux architectures where almost everything is done using the console. This implies a challenge for us where we have spent most of our careers using graphical interfaces like SQL Server Management Studio (SSMS). We know that we can use sqlcmd to execute scripts and SQL statements from the command line, but when the result set has many columns the results are hard to read.
In this tip I will cover a solution that can help you to monitor log shipping from the command line using sqlcmd.
Solution
Log shipping is the most basic technology that SQL Server offers for high availability and has been around since its first versions. It is based on backup and restore operations that are scheduled to be executed from the SQL Server Agent service. One of the advantages of log shipping is that you can have as many replicas as you want. On the other hand, its limitation is that those copies are read only if the restored database is set to standby or in a restoring state.
In the days before Always On Availability Groups were released, log shipping was the only high availability solution available that allowed read only replicas. Not even database mirroring, which has been deprecated, allowed this. Having a read only replica is useful in cases when an application needs to create reports on a transactional database because it allows you to offload the reporting queries to the read only database and avoid performance issues like blocking.
Another interesting feature of log shipping is that it isn’t tied to a specific operating system version. As a matter of fact you can configure log shipping between two servers A and B running Windows 2016 and Windows 2012 respectively. The only limiting factor is the database compatibility level. That is something that you cannot do with Always On. Also, you can configure log shipping between a Windows and a Linux server, this is something that can only be done with log shipping.
Using sqlcmd to Monitor Log Shipping
Sqlcmd is a very versatile tool, but it has an issue, we don’t have a horizontal scroll bar. Of course, this is not a fault of sqlcmd, but console applications are unable to scroll horizontally and sqlcmd doesn’t escape this limitation. This is the motive that forces us to find a way to execute queries we already know to monitor log shipping with a little bit of ingenuity.
The solution I propose consists on rewriting those queries to fit the screen. Take for example the tip Different ways to monitor Log Shipping for SQL Server databases. In that tip the author mentions three system stored procedures that allow us to monitor log shipping and get detailed information about its status.
- sp_help_log_shipping_monitor - This procedure returns the log shipping status
- sp_help_log_shipping_monitor_primary - This stored procedure is a wrapper to the log_shipping_monitor_primary table of the msdb database.
- sp_help_log_shipping_monitor_secondary - Just like the previous stored procedure, it is also a wrapper but for the log_shipping_monitor_secondary table of the msdb database.
Instead of rewriting the queries in these stored procedures, I saved the queries to script files so we can re execute them with sqlcmd by using the :r command of the sqlcmd shell. In my previous tips I suggested that it may be wise to save specific queries to files and copy those files to a folder on each new Linux server you deploy.
Adapting Log Shipping Stored Procedures to Use from Console
The following shows how I adapted these log shipping store procedures to be used and be useful from a sqlcmd console.
sp_help_log_shipping_monitor
In order to adapt this stored procedure to fit the screen we can save its results to a temporary table. Then we can display the information using different SELECT statements as follows.
SET NOCOUNT ON

create table #LSMonitor
   (
        status bit null
        ,is_primary bit not null default 0
        ,server sysname
        ,database_name sysname
        ,time_since_last_backup int null
        ,last_backup_file nvarchar(500) null
        ,backup_threshold int null
        ,is_backup_alert_enabled bit null
        ,time_since_last_copy int null
        ,last_copied_file nvarchar(500) null
        ,time_since_last_restore int null
        ,last_restored_file nvarchar(500) null
        ,last_restored_latency int null
        ,restore_threshold int null
        ,is_restore_alert_enabled bit null
        ,primary key (is_primary, server, database_name)
   )

INSERT INTO #LSMonitor
EXEC sys.sp_help_log_shipping_monitor

SELECT
      server ,
      database_name ,
      status ,
      is_primary ,
      time_since_last_backup ,
      last_backup_file
FROM #LSMonitor

SELECT
      server ,
      database_name ,
      is_backup_alert_enabled ,
      is_restore_alert_enabled
FROM #LSMonitor

SELECT
      server ,
      database_name ,
      backup_threshold ,
      time_since_last_copy ,
      last_copied_file
FROM #LSMonitor

SELECT
      server ,
      database_name ,
      time_since_last_restore ,
      last_restored_file
FROM #LSMonitor

SELECT
      server ,
      database_name ,
      last_restored_latency ,
      restore_threshold
FROM #LSMonitor

DROP TABLE #LSMonitor
GO
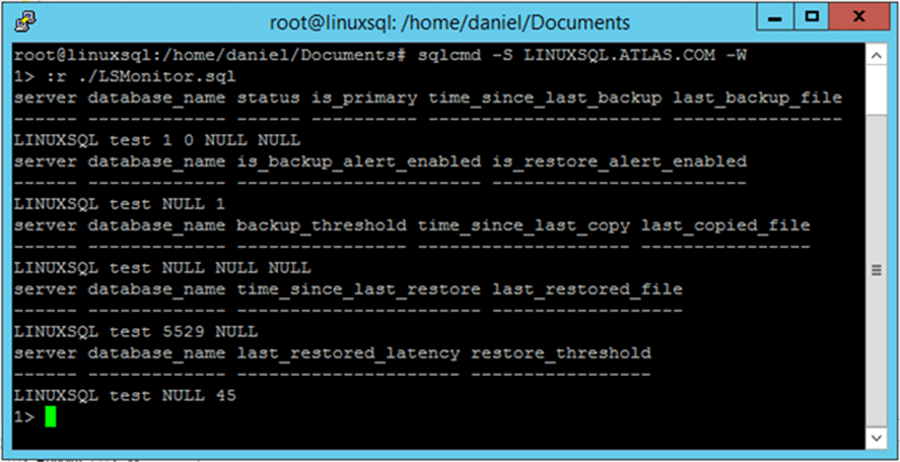
Notice that all of the select statements return the columns server and database_name. This is to maintain an order and aid the reading because they act as a primary key.
I saved the previous script on a on a file named LSMonitor.sql in the folder where I have all my scripts.
On the following screen capture you can see the output of this script when it is being executed on sqlcmd through a ssh connection to a SQL Server database running Log Shipping on Linux.

sp_help_log_shipping_monitor_primary
Since this stored procedure is a wrapper to msdb’s log_shipping_monitor_primary table, I opted to go straight to the source and query that table instead. In this case only four select statements were needed for this script which I named LSMonitorPrimary.sql.
SET NOCOUNT ON

SELECT  primary_id ,
        primary_server ,
        primary_database ,
        backup_threshold
FROM msdb.dbo.log_shipping_monitor_primary

SELECT  primary_server ,
        primary_database ,
        threshold_alert ,
        threshold_alert_enabled
FROM msdb.dbo.log_shipping_monitor_primary

SELECT  primary_server ,
        primary_database ,
        last_backup_file ,
        history_retention_period
FROM msdb.dbo.log_shipping_monitor_primary

SELECT  primary_server ,
        primary_database ,
        last_backup_date ,
        last_backup_date_utc
FROM msdb.dbo.log_shipping_monitor_primary
GO
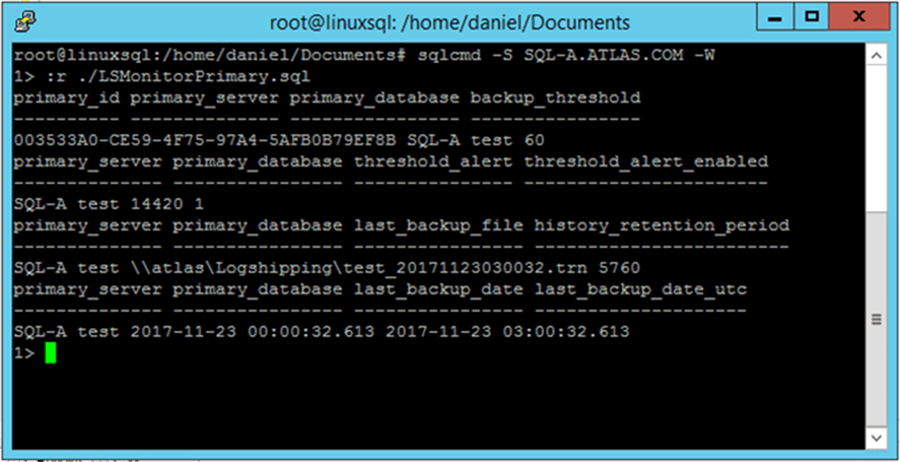
As you can see in the image below the result set of this query fits the console screen and therefore is easy to read when you need to act fast in case of a problem on the primary server.

sp_help_log_shipping_monitor_secondary
Just like in the previous case, I also opted to query the msdb table which in this case is log_shipping_monitor_secondary. As you may see in the script below, it took me five SELECT statements to display all the information in such a way that makes it legible. I created a script named LSMonitorSecondary.sql with the following content.
SET NOCOUNT ON

SELECT  secondary_id ,
        secondary_server ,
        secondary_database ,
        primary_server ,
        primary_database
FROM msdb.dbo.log_shipping_monitor_secondary

SELECT  secondary_id ,
        restore_threshold ,
        threshold_alert ,
        threshold_alert_enabled
FROM msdb.dbo.log_shipping_monitor_secondary

SELECT  secondary_id ,
        last_copied_file ,
        last_copied_date ,
        last_copied_date_utc
FROM msdb.dbo.log_shipping_monitor_secondary

SELECT  secondary_id ,
        last_restored_file ,
        last_restored_date ,
        last_restored_date_utc
FROM msdb.dbo.log_shipping_monitor_secondary

SELECT  secondary_id ,
        last_restored_latency ,
        history_retention_period
FROM msdb.dbo.log_shipping_monitor_secondary

GO
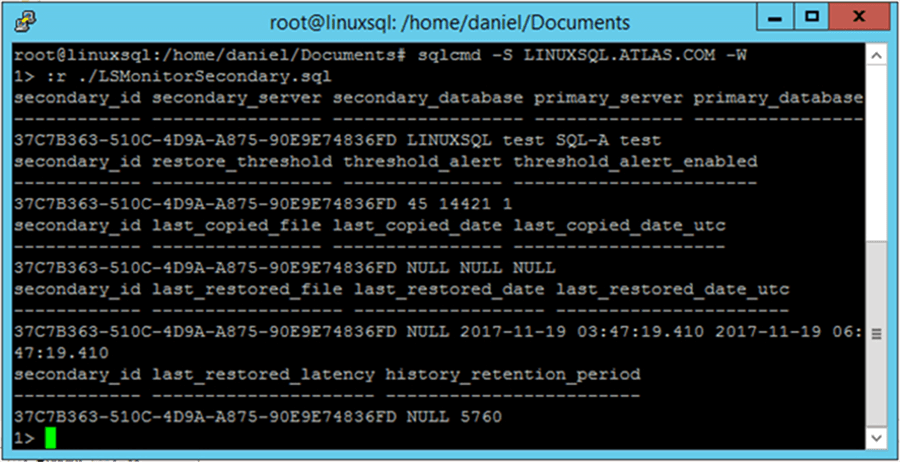
On the next screen capture you can see the results of executing this script with sqlcmd through a ssh connection.

log_shipping_monitor_error_detail
In case something fails with the log shipping jobs, you will need to query the log_shipping_monitor_error_detail table. This msdb table stores error detail for log shipping jobs for both primary and secondary servers. In this table, each error is logged as a sequence of exceptions. There can be multiple errors (sequences) for each agent session.
Since this table can contain a lot of rows I decided to show only the last five rows, but you can change the script according to your needs. I created a file named LSError.sql with the following content.
SET NOCOUNT ON

SELECT TOP ( 5 )
        agent_id ,
        agent_type ,
        session_id ,
        sequence_number ,
        database_name ,
        log_time
FROM msdb.dbo.log_shipping_monitor_error_detail
ORDER BY log_time ,
        agent_id ,
        agent_type ,
        session_id ,
        sequence_number

SELECT TOP ( 5 )
        agent_type ,
        session_id ,
        sequence_number ,
        message ,
        source ,
        help_url
FROM msdb.dbo.log_shipping_monitor_error_detail
ORDER BY log_time ,
        agent_id ,
        agent_type ,
        session_id ,
        sequence_number
GO
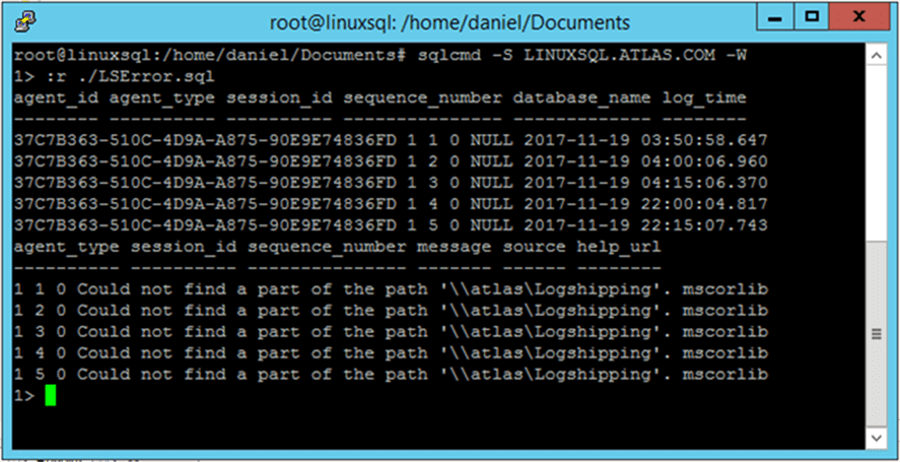
As you can see in the next image, our query fits the console screen giving us fast insight about the problem of our log shipping configuration.

Next Steps
- In case you are new to Log Shipping, the following tip can help you understand the basics: SQL Server Log Shipping.
- Also, if you need a more in depth explanation of Log Shipping, you can take a look at this tutorial: Step By Step SQL Server Log Shipping.
- If you never used sqlcmd, I suggest that you read the following tip: Introduction to SQL Server's sqlcmd utility.
- Also the next two tips may be as a great help for you: Execute SQL Server Script Files with the sqlcmd Utility and Different Ways to Connect to SQL Server Using sqlcmd.
- For more information regarding Log Shipping take a look at SQL Server Log Shipping Tips Category.
About the author
 Daniel Farina was born in Buenos Aires, Argentina. Self-educated, since childhood he showed a passion for learning.
This author pledges the content of this article is based on professional experience and not AI generated.
View all my tips


