Problem
In many businesses, the HR department needs reports on the employee attrition. This is the number of people that leave the company (depending on the reason they leave; the terminology can also be dismissals or turnover). Suppose you have a table with your employee data, where you also store a possible termination date. How do you calculate the number of people who have left the company using the DAX query language?
Solution
The business requirement is to create a report of the following format:

You can either have a table with the numbers or a visualization containing the same data. Each month shows the number of employees that have left the company. The source data can be of the following format:
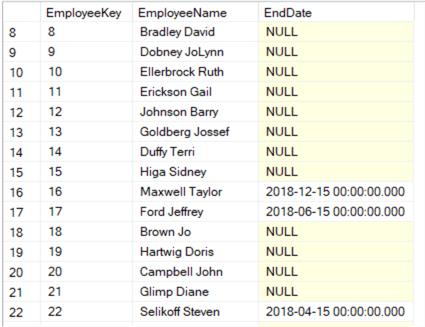
Employees that are still with the company have an empty end date, while former employees have a termination date. If the model is set-up correctly, selecting a particular month will result in the following behavior, where the selected month will be highlighted in the chart:

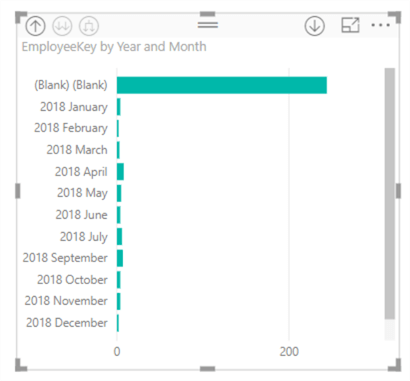
However, if you don’t take precautions within the DAX measure or if the model is set-up incorrectly, highlighting a month may have the following result:
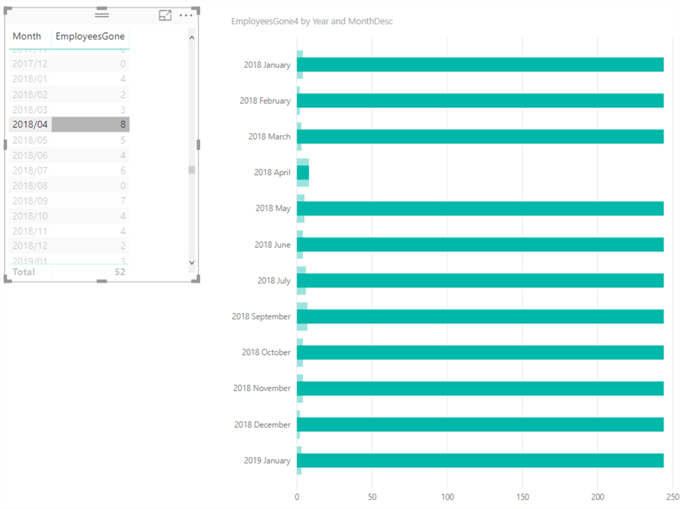
This is clearly not the intended behavior. In this tip, we’ll explain how to write a correct DAX measure or how-to set-up a model to avoid this scenario. You can apply the showcased methods in Power BI Desktop, Analysis Services Tabular or Azure Analysis Services.
Test Set-up
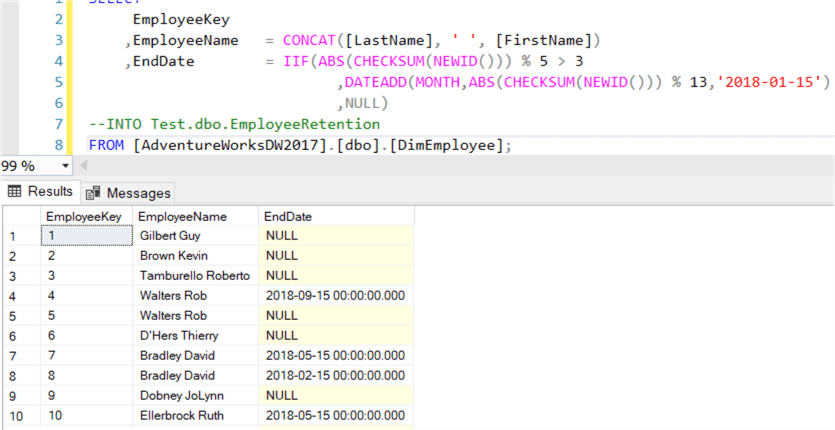
First, we need sample data. With the AdventureWorks data warehouse sample database, which you can download from GitHub, we use the following query to read employee data from the dimension and create some random termination dates:
SELECT
     EmployeeKey
    ,EmployeeName   = CONCAT([LastName], ' ', [FirstName])
    ,EndDate        = IIF(ABS(CHECKSUM(NEWID())) % 5 > 3,DATEADD(MONTH,ABS(CHECKSUM(NEWID())) % 13,'2018-01-15'),NULL)
INTO Test.dbo.EmployeeRetention
FROM [AdventureWorksDW2017].[dbo].[DimEmployee]
Two random numbers are used in the query:
- The first is between 0 and 5. If it’s greater than 3, a termination date is calculated.
- The second is between 0 and 12. This number is added as the number of months to the 15th of January 2018. Let’s just assume everyone leaves the company in the middle of the month.
The random numbers are generated using CHECKSUM(NEWID()), since the RAND function will return the same random number for each row. The query returns the following sample data of 296 rows (keep in mind the termination dates can be different on your machine):
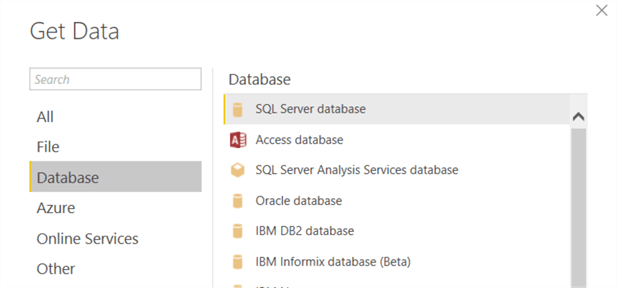
Now we can import the data. In this tip, we’ll use Power BI Desktop for the examples, but Analysis Services Tabular 2017 has about the process for importing data when you use the modern get data experience. Start a new query and choose SQL Server as the source:
Specify the connection information and choose the Import mode:
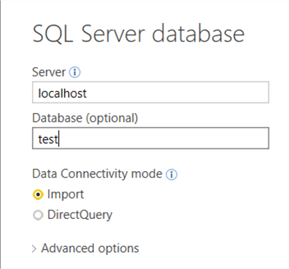
It’s possible you get a few dialogs about specifying connection credentials and encryption. Configure what is appropriate for your environment. In the navigator, choose the table we created with the query shown earlier:

Click Load to import the data into the model. Before we start writing our DAX measure, we need to fine-tune the model. The EmployeeKey gets a default aggregation of distinct count.

A distinct count is preferred for situations where the employee dimension is actually a type 2 dimension and a specific employee has multiple rows in the table. By using a distinct count, you avoid that the same employee gets counted multiple times. In our example however, this is not really necessary but we’ll set it for good measure.
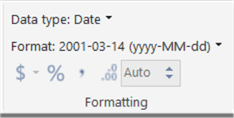
The EndDate column gets the data type date.
The model is now finished and we can start analyzing the employee attrition.
Method 1 – No DAX Required
We’ll start with the easiest option, where there is no DAX required at all. Simple add a table onto the reporting canvas and select the columns EmployeeKey and EndDate. By default, Power BI Desktop will create a basic calendar hierarchy for you:

The Quarter and Day columns can be removed from the table by deleting them in the Values pane. If you are working with Analysis Services Tabular, Power BI Desktop will not create such a hierarchy because Power BI Desktop can’t change the model for a live connection.
Since the EmployeeKey column has the distinct count configured as aggregation, the table will treat the column as a measure and it will show the count of the employees for each termination date and a grand total as well. This total shows currently the total number of employees in the company: 296. You can place a filter on the table to remove the row with the blank dates:
The table should now look like this, with a correct grand total of 52 employees who left the company (again, this number might be different on your machine):

Add a clustered bar chart onto the reporting canvas and add the same columns: EndDate on the axis and EmployeeKey as the value. Again, Power BI Desktop will create a default hierarchy.

Remove the Quarter and the Day level and drill down to the next level in the hierarchy (but maintaining the Year level as well) by clicking the third drill down button:
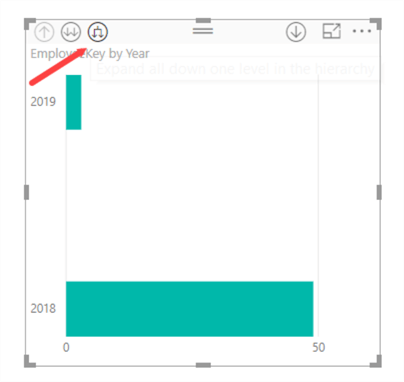
This results in the following chart:
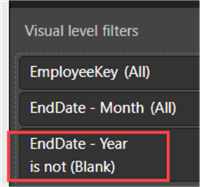
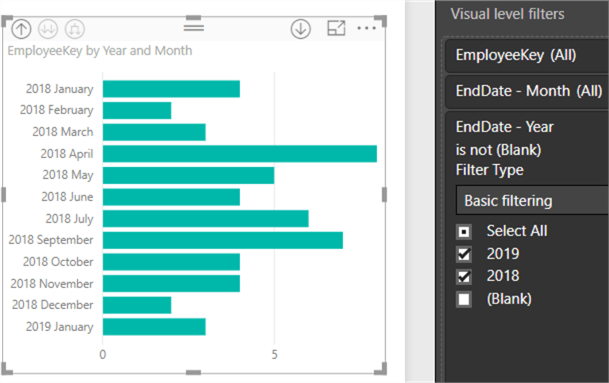
As with the table, you need to filter out the blank values:
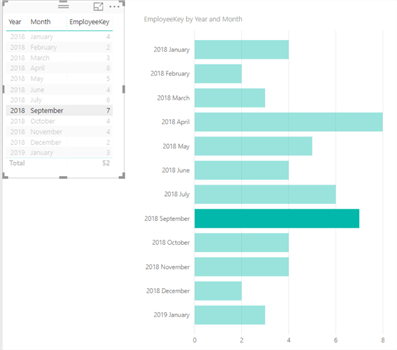
When we click on a month in the table, we get the highlighting we want:
Our analysis is done, without writing a single line of DAX. However, there are some shortcomings to this method:
- When using Power BI Desktop, you have only the generated date hierarchy to work with. You don’t have the benefits of an actual date dimension, such as being able to analyze by week or by fiscal months. When using SSAS Tabular, you even don’t have the hierarchy.
- Using EmployeeKey to calculate the employees who have left the company yields the correct results. However, it might not be intuitive for end users; they might be searching the data model for a measure with a name related to employee attrition.
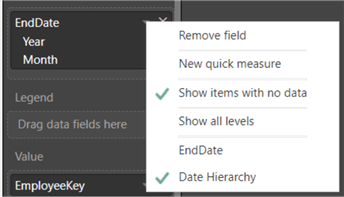
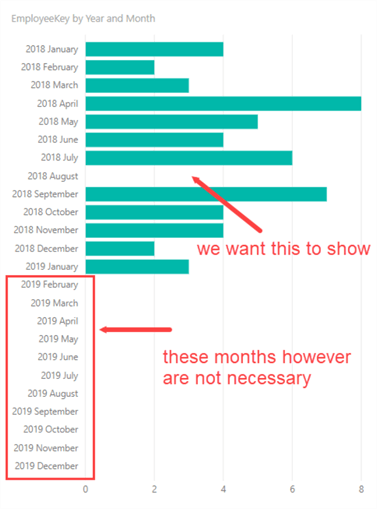
- If there are months where no employees have left – August 2018 in the example above – it will be left out of the chart. You can include it by configuring the EndDate column to show items with no data:
In our example this also results in the entire year 2019 being returned, which might not be what you want. Since there is no date dimension, you have no control over this except by defining extra filters on the visual.
In the second part of the tip, we’ll show methods using DAX calculations that try to solve these shortcomings.
Next Steps
- Try it out yourself. You can follow the steps described in this tip.
- The tip How to import data for SSAS Tabular vNext demonstrates how you can import data in SSAS Tabular 2017.
- There’s also a DAX tutorial.
- Check out part 2 of this tip!

Koen Verbeeck is a seasoned business intelligence consultant with over a decade of experience with the Microsoft Data Platform. He holds several certifications, including Azure Data Engineer. He’s a prolific writer, with over 375 articles on technologies such as Microsoft Fabric, SSIS, ADF, SSAS, SSRS, MDS, Power BI, Snowflake and Azure services. He has spoken at various events such as PASS, SQLBits, dataMinds Connect and many others. He frequently delivers educational webinars on MSSQLTips.com. For his efforts, Koen has been awarded the Microsoft MVP data platform award for many years.
- MSSQLTips Awards:
- Leadership Award (200+ Tips) – 2021
- Author of the Year – 2014/2020/2022
- Author Contender – 2024/2025