Problem
What is the new Power BI Filter Pane and how do I use it?
Solution
Power BI employs an extremely rich Slicer visual that interacts well with the other visuals that are included on a Power BI report. However, one of the main complaints has been that the slices use up very precious screen real estate, especially when you are trying to squeeze in many other actual data visuals onto a report.
Filters were previously available in Power BI, but Microsoft recently expanded and upgraded the functionality of filters within Power BI. Furthermore, the new filter pane does provide a richer way for filters to interact with visuals at the report, the page, and the visual level. With these additional flexibilities does bring about some additional complexity, and potentially confusion from the end report consumers. Of course, with these changes, the confusion may be accelerated by the fact that the filter pane is a bit hidden on the right side of a report whether in Power BI Desktop or on the Power BI Service. I have read some suggestions that the placement of the filter pane will be available to be customized including its default location within the Power BI server at some time in the future (but no promises).
The number of options on the filter pane are quite extensive, so showing various examples will likely be the best path to learning. However, before we get into the examples, be sure to download the latest version of Power BI desktop. Additionally, we will be using the WideWorldImportersDW database as a basis for our data sources; this database can be downloaded from GitHub. If you need a refresher on bringing data into Power BI please see this tip.
Power BI Sample Report to Test Filters
To help get us started, I created a simple Power BI report PBIX file and added two tabs to the report. The first tab contains a bar chart and slicer while the second tab includes a matrix and another bar chart, as illustrated in the next two screen prints.


Enable Power BI Filter Pane
The first step to using the new filter pane experience is to enable it within the Settings of Power BI Desktop.

Upon entering the Options screen, two changes will need to be made to fully enable the new filter pane experience. The first place to change is to Turn on the new filter pane via the Report settings button under the Global listing, as shown below.
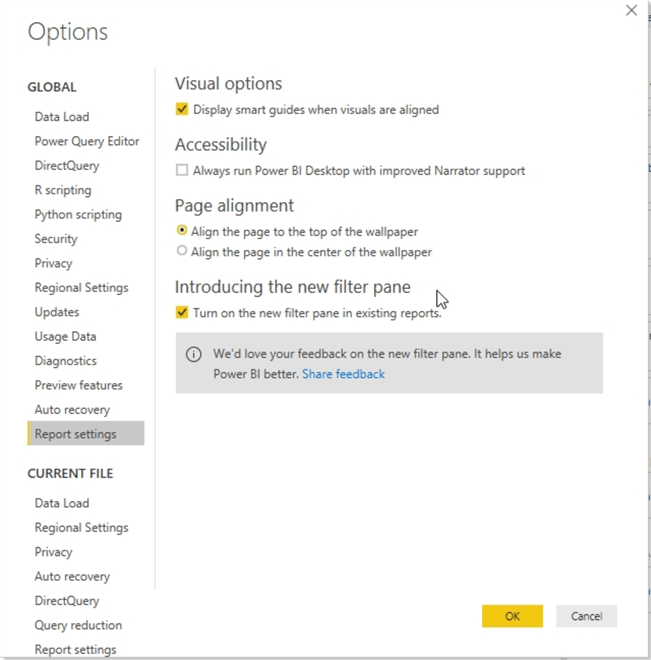
The second option that needs to be changed is on the Current File area and specifically, as illustrated next, the “Enable the updated filter pane needs and show filters in the visual header for this report” needs to be checked. Also, to be checked is the “Allow users to change the filter types” option. The second option controls the ability for report consumers to change the filter types between items such as basic and advanced filter.

Once these options have been set, we can begin to set the filter(s) on a report. One item that may come as a surprise when working with the new filter pane is that some fields are established as filters automatically. As shown below, the fields added to our visual are automatically added as “Filters on this visual”. Thus, any field used in the visual is by default a filter. Second, the only way to remove this filter is to remove the field from the visual.

Locking or Hiding the Power BI Filter Pane
Of course, you may be thinking / asking, “but what if I do not want this item to be a filter?” Fortunately, as shown below, you have two options available to handle this situation. First, the filter can be locked, by clicking the lock icon, so no changes can be made to that filter. The filter will still be displayed, but no changes can be rendered to it. The second option, which uses the eye icon, allows you to show or hide a filter. In a similar fashion the entire Filter pane can be hidden by clicking the eye icon shown in the top right corner of the filter pane.

Configuring Fields for Power BI Filters
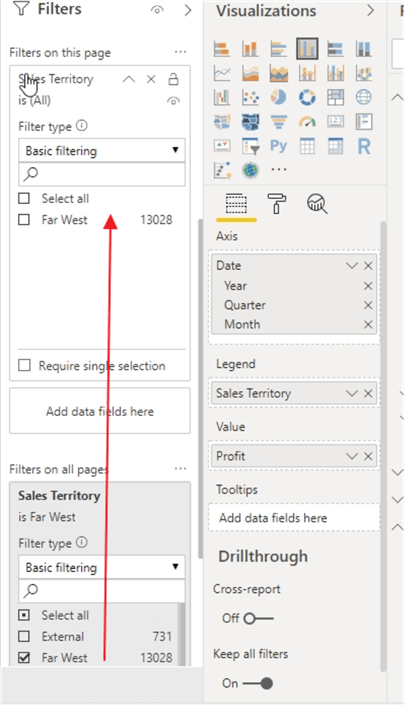
Another item you should note is that the same field can actually reside in multiple levels of the filter pane; as displayed in the screen print below, the Sales Territory field is actually in both the visual filter list and the page filter list. To add a filter, you simply drag the field from the Fields list to the box that says, “add data fields here.”

Thus, a page level filter not only impacts all visuals on a page, but as illustrated next, it also will disseminate down to the visual filters. Thus, in the example, selecting Great Lakes in the page filter for Sales Territory will initiate the visual filter to only display Great Lakes.

In a similar fashion, if a filter in the “Filter on all pages” is added (and can be the same as for the page and visual filter), it also flows to the page and visual filter along with any visual which is related to or uses the filter added to the filter. This effect is again shown below.
Delete or Clear a Power BI Filter
When dealing with filters themselves, you have the option to delete or clear a filter. Deleting a filter, using the x which is between the down arrow “v” and the lock icon, removes the filter completely. Likewise, you can clear a filter which leaves the filter intact but removes any selections that have been made for the filter. As shown in the below illustration, the eraser button, just below the x, completes the process.

Basic and Advanced Filtering in Power BI
Now moving on to the actual functionality of the filter pane, we can see that we can choose between Basic and Advanced filtering types. Remember these options are only available when the “Allow users to change filter type” preferences are selected in Report options, as described earlier.
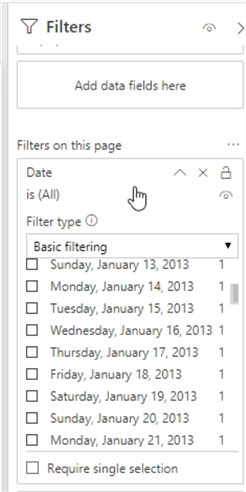
Basic Filtering in Power BI
The basic filter is just a list of values with a Select all option; additionally, you have the option of clicking the “Require single selection” checkbox to force just one value to be selected OR if none are checked, then all values are shown (i.e. no filter applied). Furthermore, when using a date as a filter with the basic filtering type, each date is listed individually as also shown below; likewise, if a field was a date time field, each individual date time would be available in the filter list. Such a situation could easily grow a filter to be quite large.

Advanced Filtering in Power BI
In order to allow more flexibility for report consumers, the advanced filtering type is offered to allow for a much more customized approach to the filter experience. Setting the filter type to advanced filtering is available both for the default / automatic filters added when adding fields to a visual and for any filters the report designer adds manually. As you can see in the below screen prints, advanced filtering provides the opportunity to add complex criteria via the use of And / Or options which allows the addition of several criteria values to the filter. For a field that is a date or date time data type, the filter can use various operators, such as, is, is not, is on or after, is on or before, is blank, or is not blank among other options. Similarly, for other field types, the available criteria types include contains, does not contain, is, is not, starts with, is blank, and is not blank. You can quickly see how rich and valuable the advanced filtering type becomes with these flexible options for setting criteria. Furthermore, a report or dashboard consumer can easily switch between the filter types as long as the option is checked in the Power BI options. We will see these filters in action on the service later in this tip.


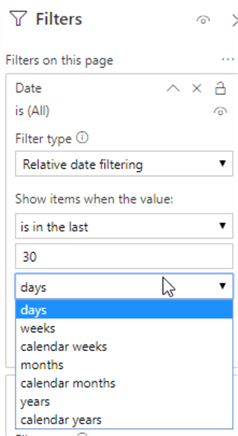
Relative Date Filtering in Power BI
One additional filter type is offered for date and datetime data types. As shown next, a date or datetime field can be set to use Relative date filtering. This alternative provides the ability to utilize relative dates instead of fixed dates. For instance, in the below example, the relative date filter is showing all values from the last 30 days, including today (as the include today checkbox is clicked on). Just as easily, the date could be “is in the next” or “is in this”. The dates can be relative to days, weeks, months, years, or calendar versions of each of these values. Finally, you may notice that with the advanced option, the Apply filter button is available in the bottom right corner of each filter and must be used to apply any filter to the visuals.


Formatting the Filtering Pane in Power BI
Next, several possibilities for formatting the filtering pane will be discussed. First, individual field boxes can be moved to any location within the filter pane, related to their filter area (visual, page, all pages). This process is a manual sort of the fields; as illustrated below, the Profit field is being dragged to another location within the Filters on this visual portion of the filter pane. To re-sort the fields automatically, the ellipse button can be selected, and then Sort A-Z or Sort Z-A, as shown in the below screen print on the right side.


In addition to being able to set the sort order, the filter pane itself can also be formatted to change the font, font and background color, and font size. To make these changes you must first select a spot on the report page design grid where no visuals exist; next select the format “paint roller” button. Upon scrolling down, two formatting areas will be shown. One for the filter pane and one for the filter cards. The filter pane is the entire filter pane outside of each field box, which are designated as the filter cards. As shown below, we have the ability to set the filter pane’s background color, font color, font size, and even the border color.

Likewise, for the individual cards or field areas, we can again set the background color, border color, font size and color, and the input box background color. Furthermore, you also have the ability to change the colors depending on whether the filter box is in an available state or applied state (meaning selections have been made in the box).


I see this being useful if you want to set a filter card background for instance to yellow while in the available state which tells the user no filter values have been selected (shown below). As soon as a value is selected, then the background for the filter changes to green (shown above).

A last option in the formatting area is the ability to revert to the default, which in turn changes all the fonts, background, borders, and other options to their original values.

Identifying Which Filter to Use in Power BI Report
As the number of filters used and available grows within a dashboard, it may become difficult for report consumers to determine which filters are applied to which visuals. Fortunately, each visual contains a funnel icon in the upper right corner that shows which filters are currently in effect for the selected visual.

As this point, we are not ready to see our filter work in the Power BI Service online. Within the service, the filter pane looks very similar to what shows in Power BI desktop.

Values can be selected and cleared online just as they can be within Power Bi Desktop. Furthermore, the user is given the option to change the filter type to advanced or basic as needed.

Filters can be applied by the end users at will.

Reset Power BI Filters to Defaults
However, if the report consumer wants to return to the original filter state, the consumer can simply click the Reset to default button, highlighted below. The report will then reset all filters to their original state; this feature certainly allows for quick and easy exploration of the data.

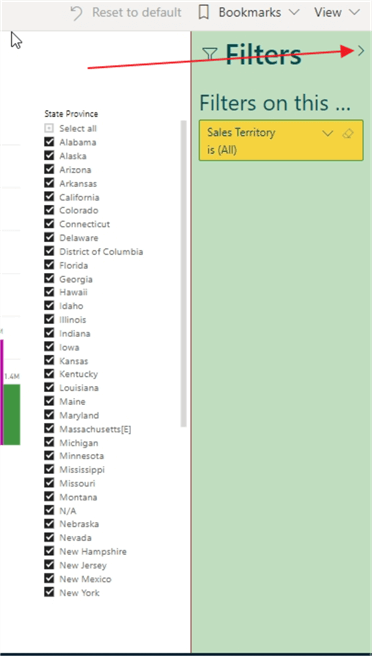
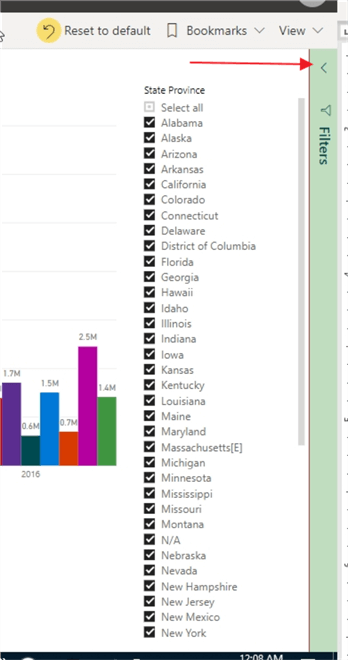
Hide and Open Filter Pane in Power BI
As previously mentioned, the filter pane can simply be hidden or opened within the service.
Saving Power BI Filters for Later Use
Finally, one last tip that is especially helpful for users who like to customize their filters is the ability to save your selected filters via the creation of a bookmark (see this tip for details on Power BI Bookmarks). Notice in the below screen shot that the bookmark saves the report in the current state.
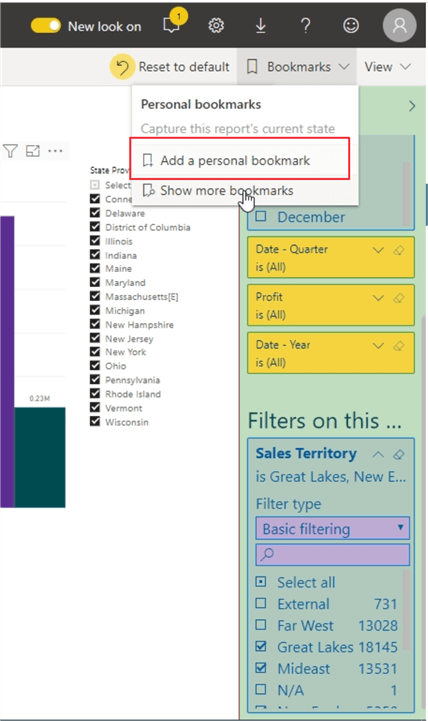
During the save process, we can also set this view, via the bookmark, as the default view / state for the report (for the individual user). Thus, every time that same user opens this report, the selected and saved filters will already be applied.

Now each time the report users navigates to this report, his or her bookmarked version of the report will open with the noted items chosen. If the default view option is not selected, then the saved bookmark view can be selected from the Bookmarks button.

The new filter pane functional provides a rich alternative to Power BI Slicers while at the same time limiting the amount of report real estate required for the filtering process. Please also note that if you are using Power BI Report Server, not all functionality may be available.
Next Steps
- Check out all the MSSQLTips.com Power BI Tips

I have a passion for crafting Business Intelligence Solutions for my user groups. My experience includes almost 15 years of SQL Server involvement with the last 12 years focused specifically on Business Intelligence, SharePoint, OLAP, SSRS, and Decision Support solutions. Currently, I am a Business Intelligence Architect in the healthcare industry, and I also teach database and analytics classes for Kennesaw State University, Southern New Hampshire University, and Reinhardt University. My education includes an MBA and an undergraduate in Accounting (yes I am a reformed accountant!), both from Kennesaw State University. I enjoy every day by trying to grow my faith and spend precious time with my family. I have been happily married to my wife of over 20 years, and we have two teenagers one who we home school with the help of a University Model School, Cornerstone Prep in Acworth, GA (cornerstoneprep.org). Our other child is a Construction Management major at KSU’s Southern Poly / Marietta campus. We are a soccer and Cross Country (XC) family who play, coach, and referee soccer or run for fun most every day. For several years, our family has volunteered (and played with the dogs and cats) at Etowah Valley Humane Society in Cartersville, GA.
- MSSQLTips Awards: Champion (100+tips) – 2016 | Author of the Year – 2015 | Author Contender – 2014, 2016-2021


