Problem
I have a data set of servers and their number of service failures for every month. I would like to show this data in a SQL Server Reporting Services report. I’m not sure how to visualize the data so that it is easy to follow which servers rank highest or lowest.
Solution
SQL Server Reporting Services (SSRS) is a flexible reporting solution suited for creating pixel-perfect reports. To visualize ranking data, there are several chart options in SSRS. A bar or column chart would be sufficient for showing absolute numbers:

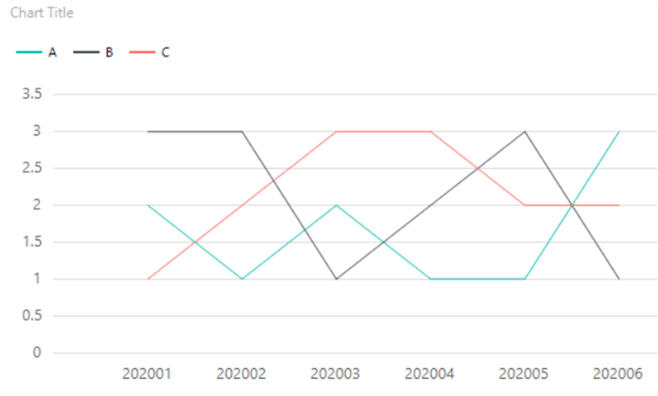
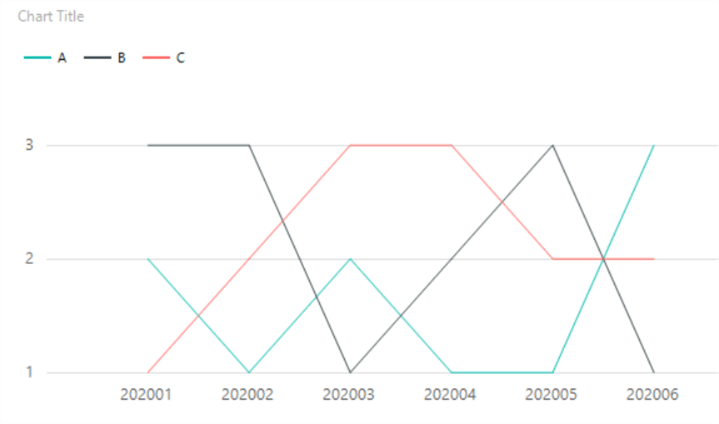
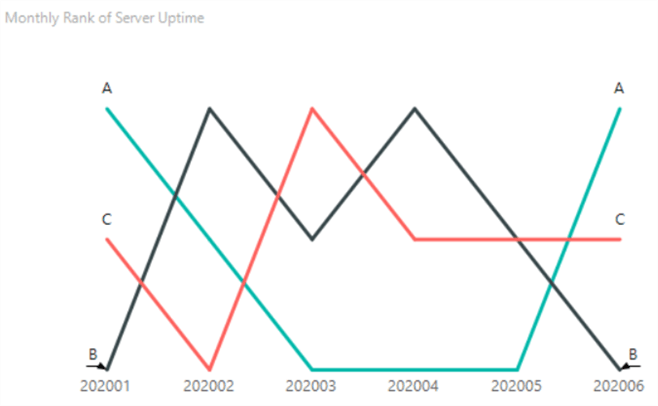
However, for showing a trend over a period of time, a line chart is a better option. In this tip, we’re going to create the following line chart:

In this chart, only the lines themselves are shown, indicating the rank of the server over time. To distinguish between the servers, the names of the servers are displayed at the start and end of the line.
Sample Data
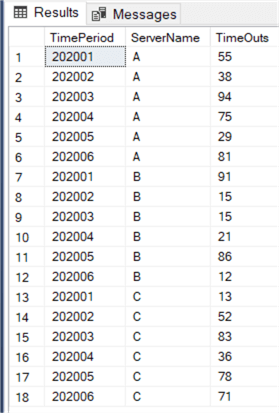
To generate sample data for this report, we’re going to use the RAND function. To get an integer number between 0 and 100, we’re multiplying with 100 and using the CEILING function. For 3 servers and 6 months, we can construct a data set with the following SQL statement:
SELECT TimePeriod = 202001, ServerName = 'A', TimeOuts = CEILING(RAND()*100)
UNION ALL
SELECT TimePeriod = 202002, ServerName = 'A', TimeOuts = CEILING(RAND()*100)
UNION ALL
SELECT TimePeriod = 202003, ServerName = 'A', TimeOuts = CEILING(RAND()*100)
UNION ALL
SELECT TimePeriod = 202004, ServerName = 'A', TimeOuts = CEILING(RAND()*100)
UNION ALL
SELECT TimePeriod = 202005, ServerName = 'A', TimeOuts = CEILING(RAND()*100)
UNION ALL
SELECT TimePeriod = 202006, ServerName = 'A', TimeOuts = CEILING(RAND()*100)
UNION ALL
SELECT TimePeriod = 202001, ServerName = 'B', TimeOuts = CEILING(RAND()*100)
UNION ALL
SELECT TimePeriod = 202002, ServerName = 'B', TimeOuts = CEILING(RAND()*100)
UNION ALL
SELECT TimePeriod = 202003, ServerName = 'B', TimeOuts = CEILING(RAND()*100)
UNION ALL
SELECT TimePeriod = 202004, ServerName = 'B', TimeOuts = CEILING(RAND()*100)
UNION ALL
SELECT TimePeriod = 202005, ServerName = 'B', TimeOuts = CEILING(RAND()*100)
UNION ALL
SELECT TimePeriod = 202006, ServerName = 'B', TimeOuts = CEILING(RAND()*100)
UNION ALL
SELECT TimePeriod = 202001, ServerName = 'C', TimeOuts = CEILING(RAND()*100)
UNION ALL
SELECT TimePeriod = 202002, ServerName = 'C', TimeOuts = CEILING(RAND()*100)
UNION ALL
SELECT TimePeriod = 202003, ServerName = 'C', TimeOuts = CEILING(RAND()*100)
UNION ALL
SELECT TimePeriod = 202004, ServerName = 'C', TimeOuts = CEILING(RAND()*100)
UNION ALL
SELECT TimePeriod = 202005, ServerName = 'C', TimeOuts = CEILING(RAND()*100)
UNION ALL
SELECT TimePeriod = 202006, ServerName = 'C', TimeOuts = CEILING(RAND()*100
The result:
Keep in mind you might be getting a different result due to the RAND function. Next up is calculating the rank. For each month, which server ranked first (as having the lowest number of failures), which server ranked second and which third?
By using the RANK window function, we can calculate this rank in one single statement:
WITH SampleData AS
(
    SELECT TimePeriod = 202001, ServerName = 'A', TimeOuts = CEILING(RAND()*100)
    UNION ALL
    SELECT TimePeriod = 202002, ServerName = 'A', TimeOuts = CEILING(RAND()*100)
    UNION ALL
    SELECT TimePeriod = 202003, ServerName = 'A', TimeOuts = CEILING(RAND()*100)
    UNION ALL
    SELECT TimePeriod = 202004, ServerName = 'A', TimeOuts = CEILING(RAND()*100)
    UNION ALL
    SELECT TimePeriod = 202005, ServerName = 'A', TimeOuts = CEILING(RAND()*100)
    UNION ALL
    SELECT TimePeriod = 202006, ServerName = 'A', TimeOuts = CEILING(RAND()*100)
    UNION ALL
    SELECT TimePeriod = 202001, ServerName = 'B', TimeOuts = CEILING(RAND()*100)
    UNION ALL
    SELECT TimePeriod = 202002, ServerName = 'B', TimeOuts = CEILING(RAND()*100)
    UNION ALL
    SELECT TimePeriod = 202003, ServerName = 'B', TimeOuts = CEILING(RAND()*100)
    UNION ALL
    SELECT TimePeriod = 202004, ServerName = 'B', TimeOuts = CEILING(RAND()*100)
    UNION ALL
    SELECT TimePeriod = 202005, ServerName = 'B', TimeOuts = CEILING(RAND()*100)
    UNION ALL
    SELECT TimePeriod = 202006, ServerName = 'B', TimeOuts = CEILING(RAND()*100)
    UNION ALL
    SELECT TimePeriod = 202001, ServerName = 'C', TimeOuts = CEILING(RAND()*100)
    UNION ALL
    SELECT TimePeriod = 202002, ServerName = 'C', TimeOuts = CEILING(RAND()*100)
    UNION ALL
    SELECT TimePeriod = 202003, ServerName = 'C', TimeOuts = CEILING(RAND()*100)
    UNION ALL
    SELECT TimePeriod = 202004, ServerName = 'C', TimeOuts = CEILING(RAND()*100)
    UNION ALL
    SELECT TimePeriod = 202005, ServerName = 'C', TimeOuts = CEILING(RAND()*100)
    UNION ALL
    SELECT TimePeriod = 202006, ServerName = 'C', TimeOuts = CEILING(RAND()*100)
)
SELECT
     TimePeriod
    ,ServerName
    ,TimeOuts
    ,MonthlyRank    = RANK() OVER(PARTITION BY TimePeriod ORDER BY TimeOuts DESC)
FROM [SampleData]
Which leads to the following result set:
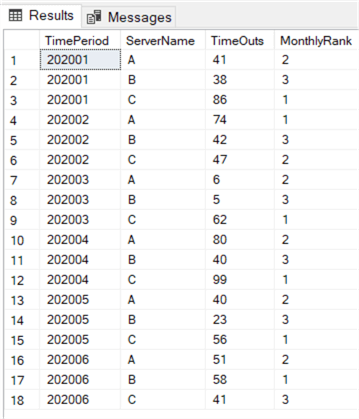
If you want to calculate the rank where “higher is better”, for example number of unique visitors, you can replace the DESC in the ORDER BY clause by ASC.
Creating the Line Chart
Open a SQL Server Reporting Services (SSRS) project in Visual Studio. Create a new report and add a new data source. Point the connection to your database.

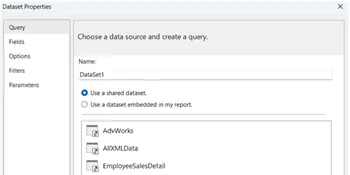
Add a new dataset, give it a name, use the data source we just created and set the query type as text.

In the query box, copy-paste the query from the previous paragraph. Close the dialog and add a new chart to the new report canvas. You can do this by right-clicking on the canvas and choosing Insert > Chart in the context menu.

In the menu, choose the line chart.

Enlarge the chart and configure it as follows:
- MonthlyRank is configured as the measure in the Values section.
- The time period is used as the category group.
- The servers are the different series groups.

When we render the report, we get the following chart:
The first step in cleaning up this chart, is fixing the vertical axis. Right-click on the axis and go to its properties. Since we know the rank will always start with 1, we can put the minimum to 1. The rank is also discrete, so the interval is also configured to 1.

This gives us the following result:
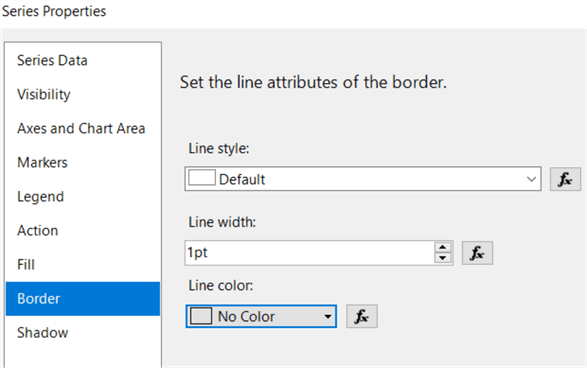
Next, we’re giving the chart a decent title, add more weight to the series, we’re deleting the grid lines, the vertical axis and the upper legend. We can change the weight of the series by right-clicking on one of the lines, going to the properties and then to the border pane.

The result:
The only problem we have left is we don’t have an indication which server is which line. To add the server names next to each line (left and right), we’re going to use the same trick as in the tip How to Create a Slope Chart in SQL Server Reporting Services – Part 2.
- We’re going to add data labels to the series, but instead of showing the rank number, we will use an expression to show the server name instead.
- Since we only want to show this at the ends, we will add two extra columns to the data set: one with the minimum time period and one with the maximum. We can create an expression that will only return the server name if the time period is equal to the minimum or maximum time period. The problem however is that we don’t have any control over where the labels will be actually placed (see the tip previously mentioned for more explanation on this). We will set the labels to be shown on the left and only if the time period is the first one.
- We will then add the same series again, hide it and show the data labels only if the time period is the last and we will put the labels to the right.
First, we’re going to adapt the T-SQL statement to include the min and max period. To do this, we’re using the window function variation of the min and max functions (by using the OVER clause), so that we don’t need to use a GROUP BY clause.
WITH SampleData AS
(
    SELECT TimePeriod = 202001, ServerName = 'A', TimeOuts = CEILING(RAND()*100)
    UNION ALL
    SELECT TimePeriod = 202002, ServerName = 'A', TimeOuts = CEILING(RAND()*100)
    UNION ALL
    SELECT TimePeriod = 202003, ServerName = 'A', TimeOuts = CEILING(RAND()*100)
    UNION ALL
    SELECT TimePeriod = 202004, ServerName = 'A', TimeOuts = CEILING(RAND()*100)
    UNION ALL
    SELECT TimePeriod = 202005, ServerName = 'A', TimeOuts = CEILING(RAND()*100)
    UNION ALL
    SELECT TimePeriod = 202006, ServerName = 'A', TimeOuts = CEILING(RAND()*100)
    UNION ALL
    SELECT TimePeriod = 202001, ServerName = 'B', TimeOuts = CEILING(RAND()*100)
    UNION ALL
    SELECT TimePeriod = 202002, ServerName = 'B', TimeOuts = CEILING(RAND()*100)
    UNION ALL
    SELECT TimePeriod = 202003, ServerName = 'B', TimeOuts = CEILING(RAND()*100)
    UNION ALL
    SELECT TimePeriod = 202004, ServerName = 'B', TimeOuts = CEILING(RAND()*100)
    UNION ALL
    SELECT TimePeriod = 202005, ServerName = 'B', TimeOuts = CEILING(RAND()*100)
    UNION ALL
    SELECT TimePeriod = 202006, ServerName = 'B', TimeOuts = CEILING(RAND()*100)
    UNION ALL
    SELECT TimePeriod = 202001, ServerName = 'C', TimeOuts = CEILING(RAND()*100)
    UNION ALL
    SELECT TimePeriod = 202002, ServerName = 'C', TimeOuts = CEILING(RAND()*100)
    UNION ALL
    SELECT TimePeriod = 202003, ServerName = 'C', TimeOuts = CEILING(RAND()*100)
    UNION ALL
    SELECT TimePeriod = 202004, ServerName = 'C', TimeOuts = CEILING(RAND()*100)
    UNION ALL
    SELECT TimePeriod = 202005, ServerName = 'C', TimeOuts = CEILING(RAND()*100)
    UNION ALL
    SELECT TimePeriod = 202006, ServerName = 'C', TimeOuts = CEILING(RAND()*100)
)
SELECT
     TimePeriod
    ,ServerName
    ,TimeOuts
    ,MinPeriod      = MIN(TimePeriod) OVER()
    ,MaxPeriod      = MAX(TimePeriod) OVER()
    ,MonthlyRank    = RANK() OVER(PARTITION BY TimePeriod ORDER BY TimeOuts DESC)
FROM [SampleData]
To show the data labels, right-click on a line and choose Show Data Labels.

Right-click on the data label to view the context menu:

Click on Series Label Properties… to go the properties menu.

In the general pane, click on the expression symbol next to the label data box to configure the expression. The following expression is used to set the data label to the server name if the time period is the first period:
=IIF(Fields!TimePeriod.Value = Fields!MinPeriod.Value
      ,Fields!ServerName.Value
      ,""
      )

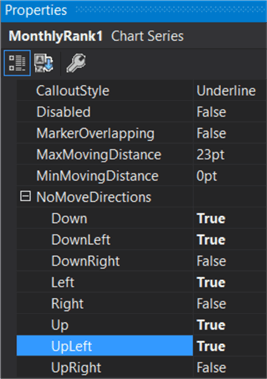
Select one of the lines and in the properties, go to SmartLabels and then to NoMoveDirections.

The chart now should look like this (again, due to the random numbers it may be different from what you’re seeing):

To force the labels on the right side, we’re duplicating the series by adding MonthlyRank again to the Values.

Repeat the same steps as for the left labels. This is the expression for the data labels on the new series:

And these are the SmartLabel settings:
Finally, we’re setting the color of the border and the fill color to “No color” to “hide” the duplicated series:
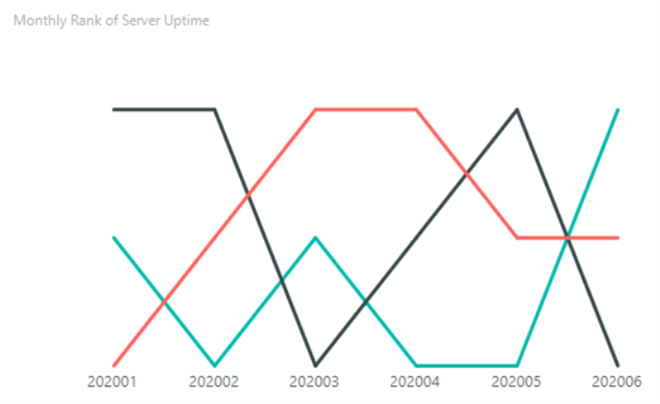
You cannot actually hide the series using the “hidden” property, because this would hide the data labels as well. The final chart looks like this:
Next Steps
- Try it out yourself! You can follow along with the steps outlines in the tip to get our own line chart.
- To learn more about window functions, check out the tutorial.
- The following tip delves deeper into the RAND function: Using SQL Server RAND Function Deep Dive.
- For more Reporting Services tips: Reporting Services Tips.

Koen Verbeeck is a seasoned business intelligence consultant with over a decade of experience with the Microsoft Data Platform. He holds several certifications, including Azure Data Engineer. He’s a prolific writer, with over 375 articles on technologies such as Microsoft Fabric, SSIS, ADF, SSAS, SSRS, MDS, Power BI, Snowflake and Azure services. He has spoken at various events such as PASS, SQLBits, dataMinds Connect and many others. He frequently delivers educational webinars on MSSQLTips.com. For his efforts, Koen has been awarded the Microsoft MVP data platform award for many years.
- MSSQLTips Awards:
- Leadership Award (200+ Tips) – 2021
- Author of the Year – 2014/2020/2022
- Author Contender – 2024/2025