Problem
As a database administrator or consultant, having a quick view of a SQL Server environment can be extremely helpful. There are many tools and queries that you can run to gather information, but putting this all together into a comprehensive dashboard is not that hard with the help of a SQL Server Reporting Services (SSRS) report. In this article, we look at a custom SSRS report that gathers information from many different parts of the SQL Server environment and displays them all in one central location for quick analysis and troubleshooting. And since this is an SSRS report, it is easily customizable to meet your needs.
Solution
I created an open-source solution called StudyYourServer, that is a set of SSRS reports built to work as custom reports inside SQL Server Management Studio (SSMS). In this tip I will show you how to import the Server Dashboard report to SSMS and what is included in the report.
SSMS Custom Reports
You have probably noticed in SSMS that there are standard built in reports. In addition, there is an option to import your own custom SSRS reports.

A custom report is just importing your own reports into SSMS, these reports are standard .rdl files that you can develop using SSDT.
Requirements for this Solution
Since the most recent SQL Server Data Tools (SSDT) version was used, there are some compatibility requirements for the reports to work:
- Supported for SQL Server 2012 or newer only
- Azure SQL database is not supported
- SSMS 17.9 or newer, you can download the latest SSMS version here.
Once you have validated all the requirements, you can import the reports.
Download Custom Report
To download the custom Server Dashboard report, click here. Save the RDL file in a location on your desktop to be used in the import step.
Import Custom Reports into SSMS
Note: for instance-level reports right click on the instance name and for database-level reports right click on the database and follow the steps above.
To import the custom Server Dashboard report, right click on the instance name in SSMS, select Reports > Custom Reports and then select the RDL file you want to import.

Locate the StudyYourServer – Dashboard.rdl file you saved previously.

Note: even when the reports are imported, do not delete the original files or the next time you try to access them it will be removed from SSMS.
Server Dashboard Report Overview
To access the report, right click on the SQL Server instance and go to Reports and the report should now appear as shown below. Click on the report to view the report contents.

The report will display and will present you information about that instance (we will discuss each section):

Overall, the report presents multiple sections highlighting areas that need your attention, which are considered “best practices”, but please note that a best practice is not a rule and some of the highlighted information may not apply to your environment. Tool tips are provided when you hover over attention areas, hinting what needs to be done to address each finding.
Now let us go to each section of the report.
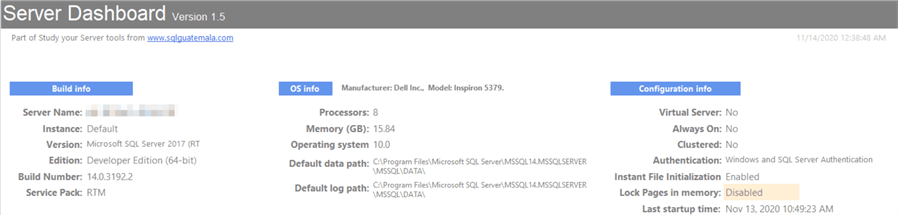
General Instance Information
Most of the information here is relevant to the OS configuration, it also indicates the current version, edition, and patching level of the SQL Server. For SQL Server running on Linux, some of these fields will be empty.
For my laptop we can see that Lock pages in memory is not enabled, so it highlights this field as something important.
If you hover over the Lock Pages in memory section, extra information is displayed as shown below.

Network Protocols
The network protocols shows the currently enabled protocols and for TCP/IP the port is displayed (for static ports), if the port is dynamic the port information will be empty.

Instance Components
Components configured for that instance, along with the status and account information (note that shared components are not displayed here).

Disk Information
Relevant information related to disk drives where database files exists (other drives in the operating system are not displayed since report is instance scoped).
If any drive has low free space it will show a warning between 20% and 10% (yellow) and alert below 10% (red).
Also, a bar chart is included for easy comparison of drives (this example was done on my personal laptop, where I just have one drive).

Database Information
This is one of the sections I use most. We can quickly check for important database configuration options and quickly retrieve the size of all the databases in the instance. We can easily spot databases that do not have the latest compatibility level, have the wrong recovery model or the wrong page verification option.
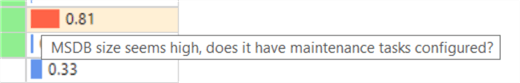
The msdb database has a special check for size, since a big msdb database could indicate missing maintenance and cleanup tasks, that can slow down other processes in the instance.
In case you need to dig deeper into any of the databases, there is a database scoped report available in part 2.

Tooltips are configured as well:
Logins with Elevated Permissions
Does your instance have more sysadmins than needed, that could be a security concern.

Trace Flags Enabled
This shows which trace flags are enabled on the instance at the moment of report execution.

Instance Configuration Values
This shows the settings you can manipulate via sp_configure. Most relevant options are always highlighted in green regardless of its value, if the value in use needs your attention it will be highlighted in yellow.
This report does not enable the ‘show advanced options’ option, so running this report does not change any configuration on your instance.

As with the other highlighted information, tooltips are also configured showing you more information about a specific option:

Suspect Pages
This obtains information from suspect_pages table in msdb. If this section returns records, it is worth checking the database further issues. Healthy instances should have this section empty.

Memory Dumps
The last section of this report is related to information from sys.dm_server_memory_dumps. If records are in this section, it is worth checking them for potential issues, especially if the dumps have a recent creation date or you have multiple entries.

Fully customizable
Since this is an open-source report, you can modify it to include more information or change how the information is presented. If you encounter issues or incorrect information you can simply change as needed.
Remember, a best practice is just a standardized way of doing things that has proven to work in most cases and is generally accepted, but some of those recommendations may not work for you. Use these reports as a general guide and always use common sense and your expertise to determine if an option may or may not work for you.
Next Steps
- Download the rdl file for this article (version 1.5 of the report).
- In Part 2 we will discuss database level report.
- By reviewing the source code of the .rdl report you can check the queries used in each section.
- You can check best practices tips here.

Eduardo Pivaral is an MCSA, SQL Server Database Administrator and Developer with over 15 years of experience working in large environments.
- MSSQLTips Awards: Trendsetter (25+ tips) – 2020 | Author of the Year Contender – 2019 | Rookie of the Year – 2018


To fix the error I was receiving due to the huge size of the DB, I used Bobby’s idea, and I used the “cast(DF.size as BIGINT) inside the original cast.
DF.type_desc
,DF.physical_name
,DF.state_desc
,cast((cast(DF.size as BIGINT)*8)/1024/1024. as numeric(9,4)) as [SizeGB]
,cast((FILEPROPERTY(DF.name,’SpaceUsed’)/128.0)/1024.0 as numeric(9,4)) as SpaceUsedGB
,cast(((cast(DF.size as BIGINT)*8)/1024/1024.)-(FILEPROPERTY(DF.name,’SpaceUsed’)/128.0)/1024.0 as numeric(9,4)) as SpaceFreeGB
Great report!!!! If anyone gets errors when you try and use it, read below….
Large databases will throw errors when you try and open the report. I corrected the query by bringing it into VS and changing the database size calculation to cast the value as bigint in databasediskinfo.
SELECT
[db].[name] AS [DBName],
[create_date],
[compatibility_level],
[state_desc],
[recovery_model_desc],
[page_verify_option_desc],
iif(([db].[database_id] < 5), ‘Yes’, ‘No’) AS [system_DB],
[DI].*
FROM [sys].[databases] AS [db]
INNER JOIN (SELECT
[f].[database_id],
[volume_mount_point],
[logical_volume_name],
(sum(CAST([f].[size] AS BIGINT) * 8) / 1024.0 / 1024.0) AS [dbSizeGB],
([total_bytes] / 1048576.0 / 1024.0) AS [totalSpaceGB],
([available_bytes] / 1048576.0 / 1024.0) AS [freeSpaceGB]
FROM [sys].[master_files] AS [f]
OUTER APPLY [sys].dm_os_volume_stats(
[f].[database_id], [f].[file_id])
GROUP BY [f].[database_id],
[volume_mount_point],
[logical_volume_name],
[total_bytes],
[available_bytes]) AS [DI]
ON [DI].[database_id] = [db].[database_id]
ORDER BY [system_DB] DESC,
[DBName];
Very nice. Anything related to query stats would be very helpful as well. Looking forward for next reports.
This looks pretty cool! Good job!