Problem
The need to build a modern data platform in the cloud is ever growing across numerous organizations that are interested in establishing their footprint in the cloud. Planning for and setting up this initial ground work may be challenging to present to customers and demonstrate immediate value from investing in this foundational journey. Customers that have limited experience and expertise in planning for a cloud data warehouse might be seeking a structured process for engaging in their first cloud data warehousing project. How can they get started with planning for a cloud data warehouse project?
Solution
Planning for a cloud data warehouse can be challenging. After customers realize the critical value of implementing a cloud platform, they can leverage some of the guidelines listed in this article which describe how to design and implement a foundational cloud data platform in Azure. This article will focus specifically on a foundational Azure cloud data platform that could be designed for an organization that is in its infancy on cloud technologies and that are seeking to kick-start this foundational journey with a lower budget and smaller subset of data.
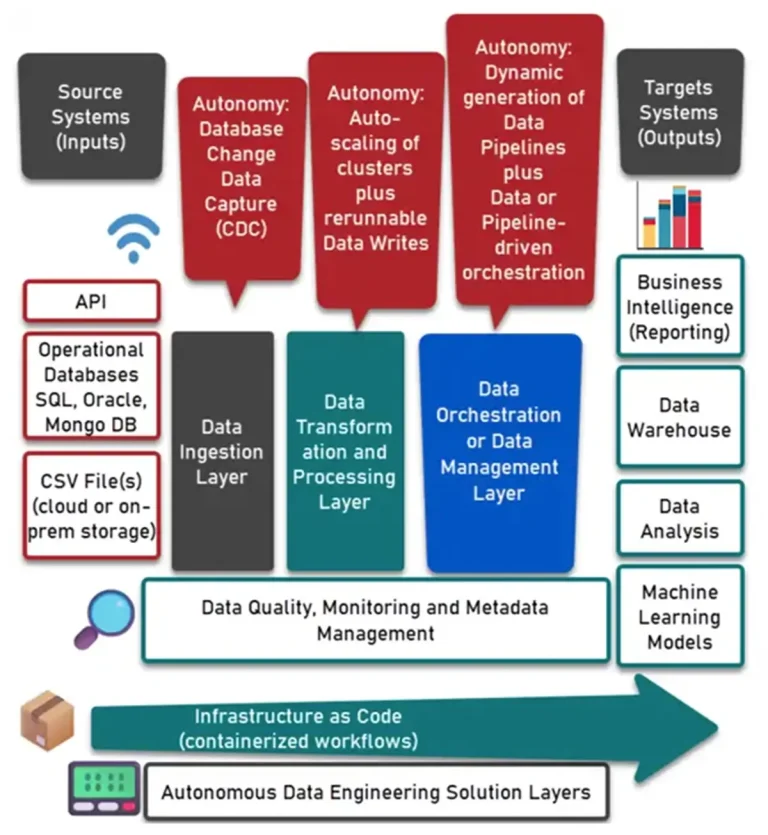
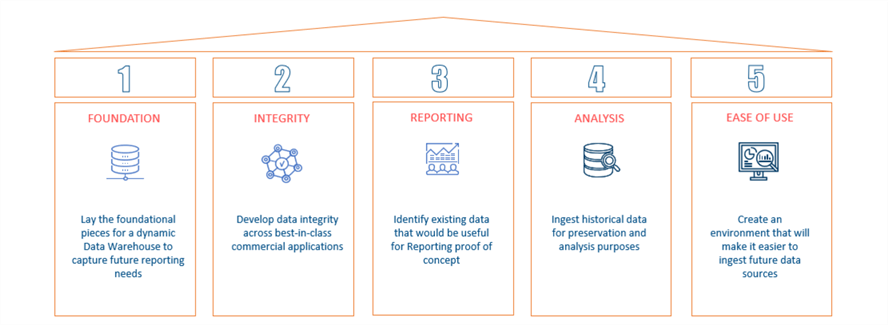
There are numerous benefits to a Cloud data warehouse including the following foundational pillars for a successful cloud data platform.
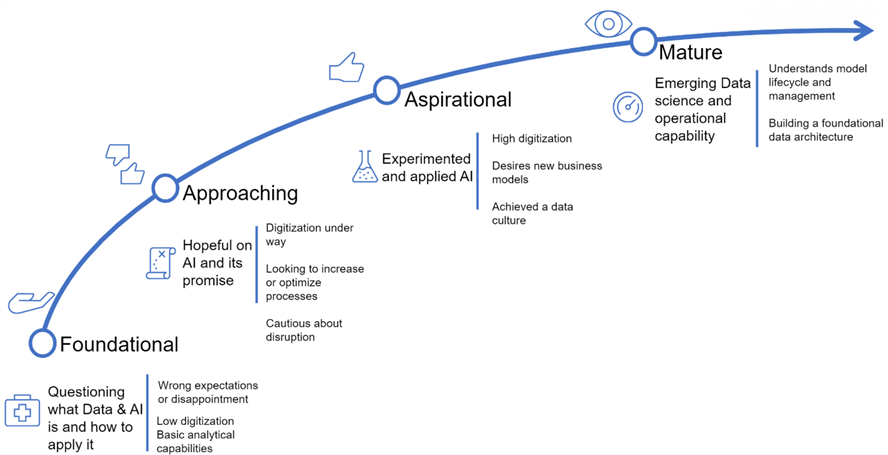
Every organization is unique and at a different maturity level on their cloud journey. More mature organizations might be seeking to begin a project that harnesses the power of AI and Machine learning to drive business growth and uncover insights in their big data ecosystems through distributed cloud computing. On the other hand, customers that are beginning their journey in a cloud platform such as Azure might be more interested in championing a foundational platform through an initial project that demonstrated immediate values that is low in both cost and delivery time.
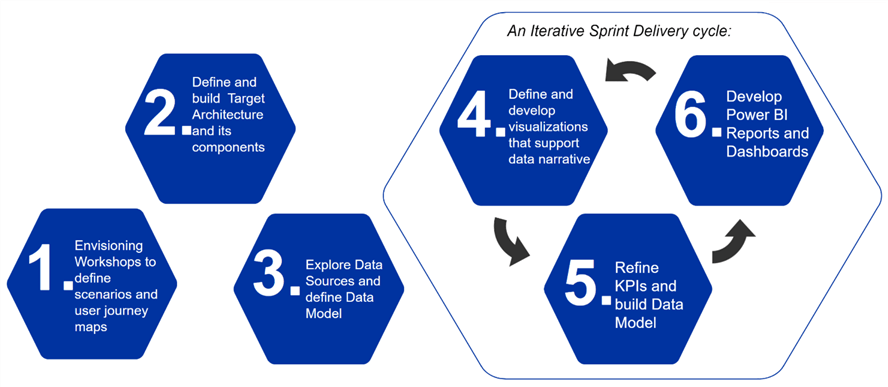
From a foundational project planning perspective, it is always a recommended and valuable exercise to initiate with envisioning workshops to define the scenarios and user journey maps. This would typically be followed by a detailed and defined data architecture & flow diagram, followed by costs, risks, delivery plans and timelines, and staffing profiles to estimate overall total cost of ownership (TCO).
Designing the Solution
The first step of any envisioning phase is the engage with the customer through workshops and interviews to understand the current data landscape and gaps, review architecture options, and propose a target data architecture and flow along with associated monthly cost.
Workshops & Interviews
Workshops Overview
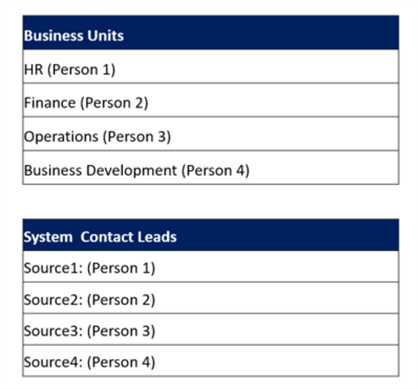
Interviewing business unit leads across each of the main systems to gain a summary view of the current and future state systems, data and reporting is an important exercise. These meetings could lead to subsequent discussions with specific users of the systems for a comprehensive understanding.
As a sample, there could potential be 10-20 meetings spread over a 1-month timeframe to analyze (n) number of sources and (n) number of reports:
- Initial Meetings: 4
- Follow-Up Meetings: 10-12
- Reports: ~20-30 reports
- Data Sources: 4 systems
Defining a list of contacts across business units and systems will help with identifying experts, sponsors, champions, and advocates of a new cloud data platform.
Interview Guide
When conducting interviews and workshops during the envisioning phase, the following sample questions spanning general to context to data related questions will help with providing inputs for tangible deliverables at the end of the envisioning phase. Here are a few typical questions that might be raised to various members of the organization as part of the envisioning phase.
Setting the stage
Expand on how you measure and consume metrics in each of the critical categories:
- Which data sources are used?
- How are the calculations configured?
- What critical grouping attributes exist (e.g., Business Unit, Region, Partner) and is the Operations team responsible for managing all groupings?
- Are business intelligence metrics standard across projects, business units and functions?
- Are there additional categories not covered in our current understanding?
- How are reports distributed and consumed? Do security permissions exist?
- What pain points (data integration, ETL \ ELT, data analytics, cloud compute costs, query performance, real-time data access, etc.) do you encounter in creating, distributing and consuming current reporting?
- What is the current and desired refresh cadence? How does this differ by level of detail (e.g., project-level vs. portfolio vs. organizational tracking)?
- What is your wish list of reports to create in the future state? What challenges to you see in creating these reports?
User Context Questions
- Primary goals for reporting. What metrics/elements need to be prominently featured?
- Do we have a defined KPI list?
- Should we have KPIs on one dashboard or on several dashboards?
- Who (roles) will use this product?
- Do we need to grant different types of access and/or visibility level for these roles?
- What are business expectations for each role (admin, end user, etc.)?
- Who will validate the end look and feel for this dashboard?
- What are the key elements (Modules, steps) in the current data flow from the data generation until the data publishing?
- What are current pain points (i.e. data analysis, optimize visualizations, querying, automation, etc.) and how do you solve them (current reports can be used as examples)?
Data Related Questions
- Which source data systems do you interact with to run your business?
- How do you currently extract, transform and analyze data with cloud services (i.e. Azure, AWS, Google Cloud, IBM, Oracle, etc.) or on-premises relational database solutions such as SQL Server?
- What data quality issues exist, and where is data quality high?
- Do you regularly run validations or reconciliations within or between data sources? How are control totals generated and used?
- What procedures are in place to update data source systems? Are they manual or automated (e.g., change in project target dates, etc.)?
Current Data Landscape
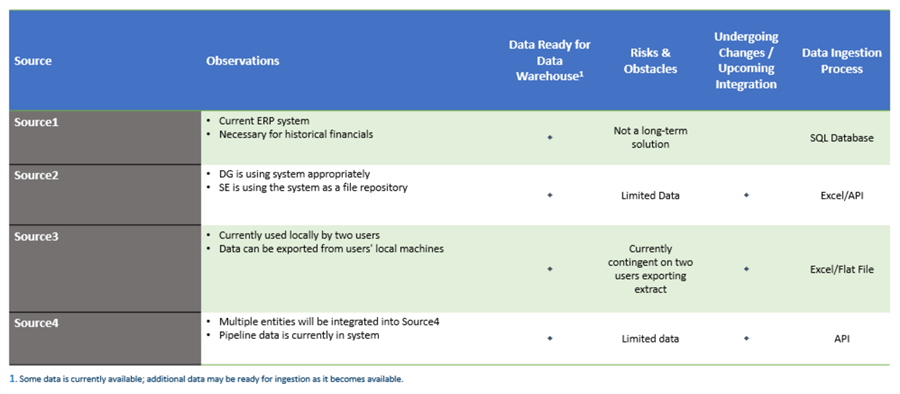
One output from the envisioning phase could be a detailed description of the current data landscape which uncovers the various sources, observations, risks, platform and more. This information will be pivotal for the architects that are defining the data architecture and flow based on available inputs around current and future state.
Architecture Options
When designing a cloud data platform and warehouse solution there can be many factors that impact the target architecture ranging from data (volume, velocity, variety) to cost to performance and so on. Data warehouse and storage options may range from Snowflake to Synapse to SQL Database and more.
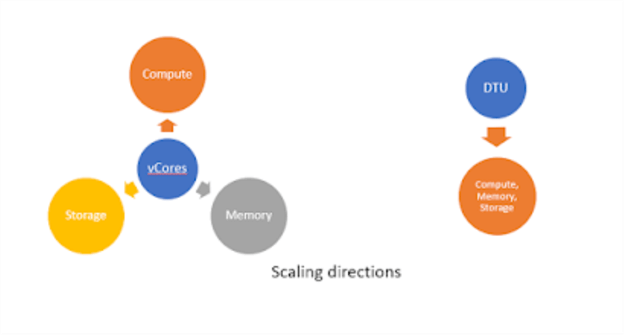
SQL DTU vs vCore Database
There is a vast number of SQL database options in Azure including DTU virus vCore. DTU and vCores are two different purchasing models for Azure SQL which include variations in computation, memory, storage, and IO. Azure pricing calculator can help with aligning cost and capability with the appropriate SQL Database solution. Please see the Next Steps section of this article for more resources related to SQL DTU vs. vCore along with the advantages and disadvantages of vCore.
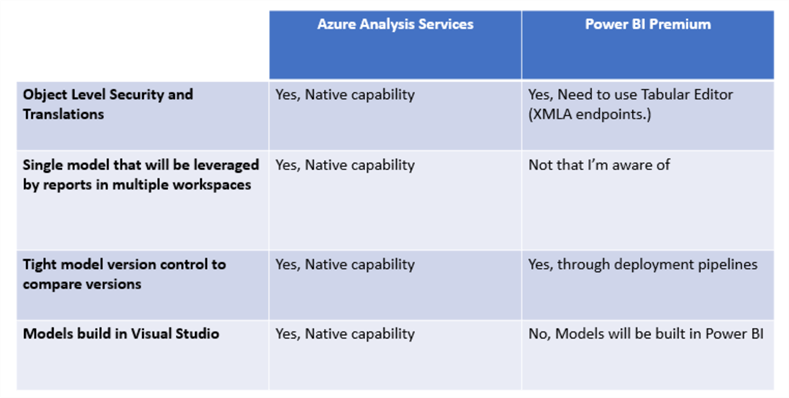
Analysis Services + Power BI Pro vs. Power Premium
Another consideration in the modern Azure Data Platform architecture might be around choosing the right data modeling tool. Again, as with other purpose driven tools, there are many choices for data modeling tools ranging from DBT to Azure Analysis Services to Power BI Premium. Putting together a comparison that can be visually shared via workshops to discuss advantages and disadvantages to help with choosing the right tool is a valuable exercise that must be conducted during the envisioning phase.
Here is a sample comparison between Azure Analysis Services and Power BI Premium.
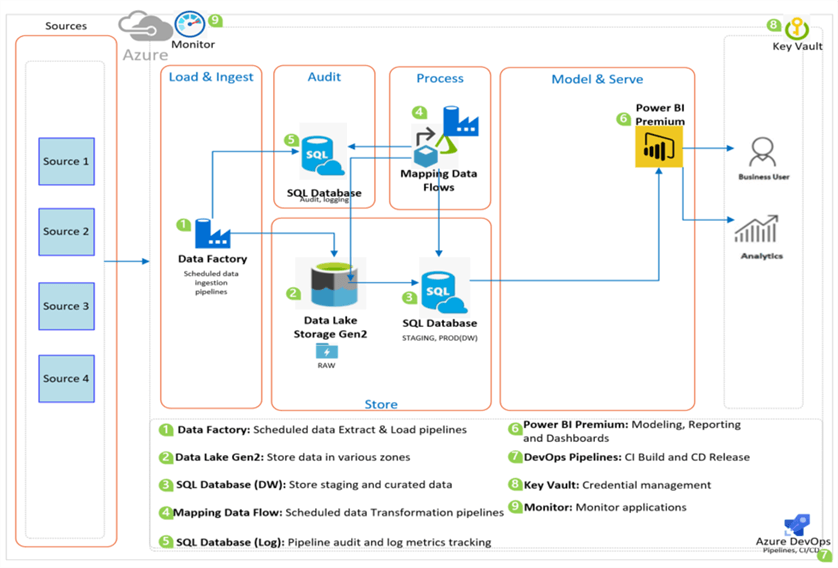
Data Architecture
As additional inputs related to data, current and future state, gaps and more become available through the envisioning phase, the Data Architecture will become clearer and can be diagramed and presented as another output from the envisioning phase.
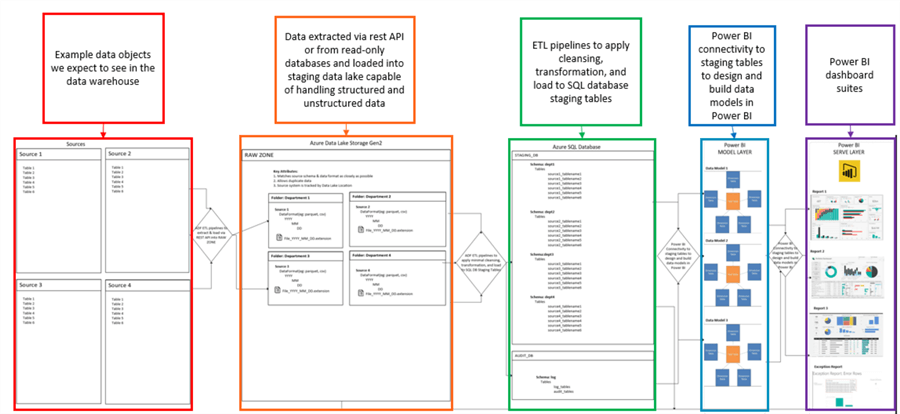
Data Flow
Similar to the process of creating a data architecture diagram, a data flow diagram is one level more granular than the data architecture diagram and included more detail around the data flow from source to target to report to demonstrate the entire end-to end data flow based on inputs from the workshops of the envisioning phase.
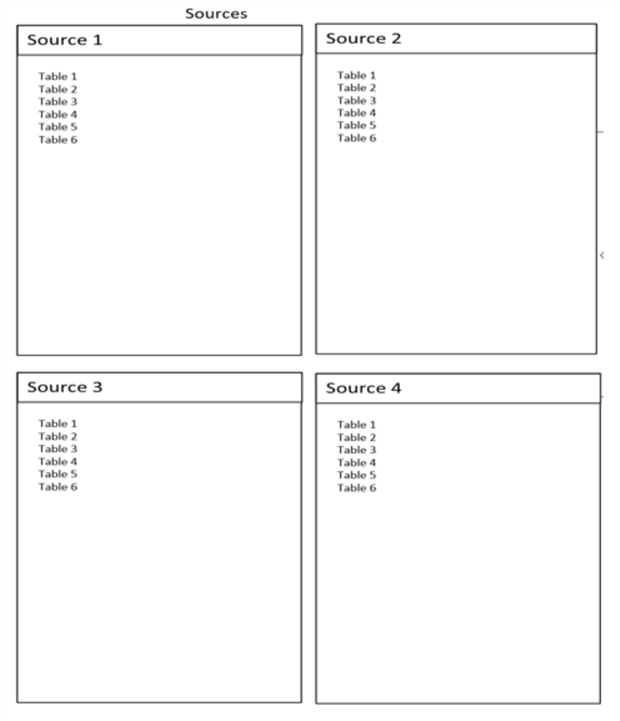
Data Sources
As an example, the data sources section of the data flow diagram may include the sources along with the high-level tables or objects that need to be extracted and ingested.
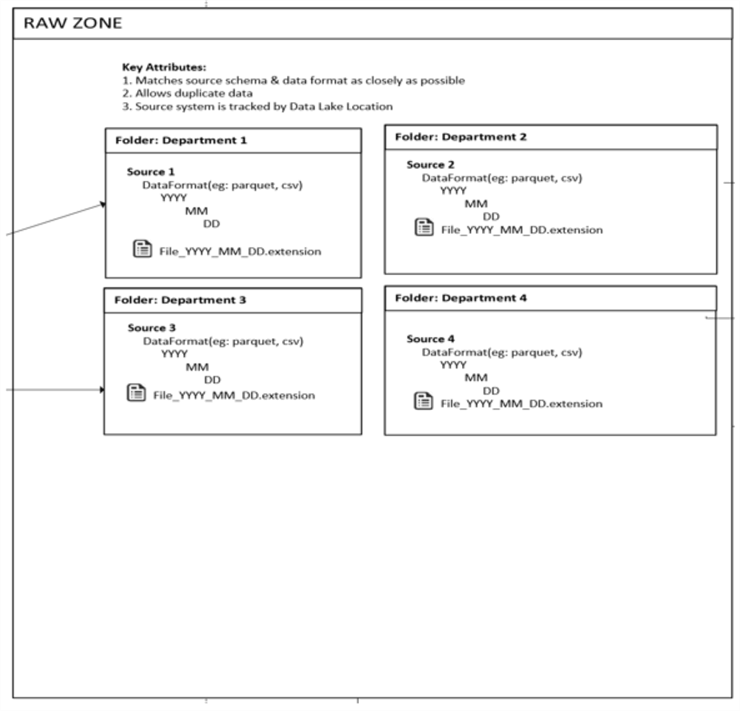
Data Lake Storage
Designing an Azure Data Lake is a critical step in the architecture design process; therefore, it would be crucial to define the data lake hierarchy and folder structure upfront to once again present a visual image of what the data lake storage layer might look like.
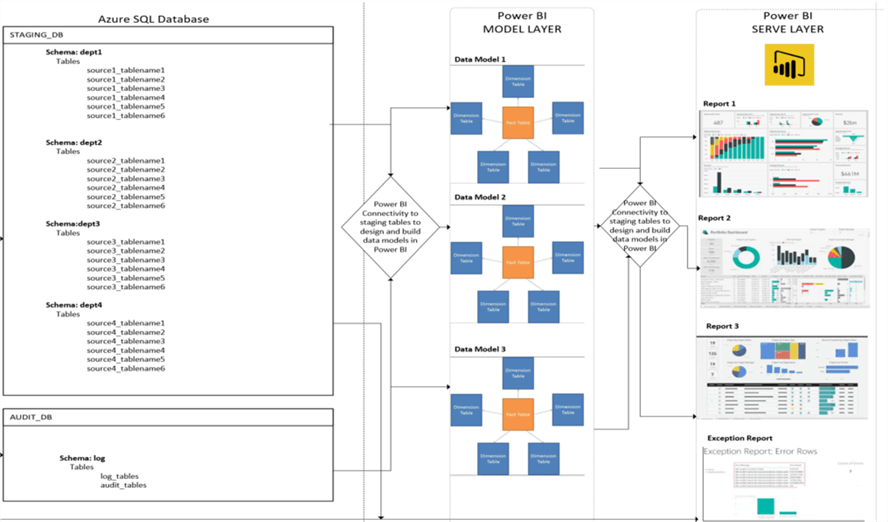
SQL Database & Power BI
Similarly, it would be critical to define, in as much detail as possible, the staging, modeling, and reporting layers of the proposed solution to demonstrate how the customer would be able to get tangible value out of this project and to show the visual flow of data from source to user reports.
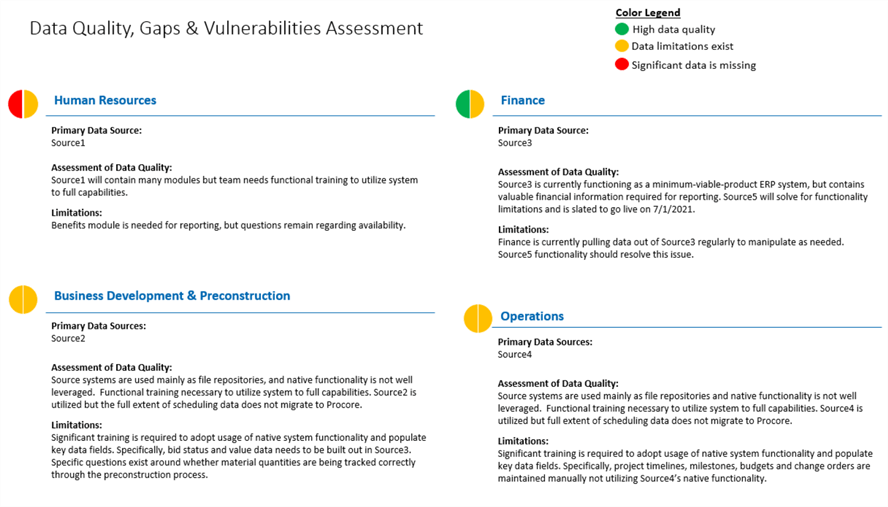
Data Quality, Gaps & Vulnerabilities
As part of the envisioning phase, many of the data quality gaps and vulnerabilities may be uncovered. One additional output of the envisioning phase could be to clearly highlight the assessment of the data quality along with the limitations.
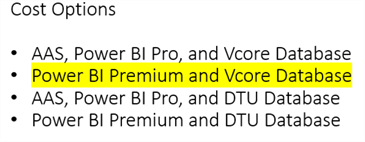
Costs
Costs are a major component that could determine whether a project moves from the envisioning to the initial implementation phase, therefore it would be wise to approach all conversations around cost sensitively. Azure offers a vast array of solutions and exploring various options around cost is a valuable exercise to engage the customer with. Azure’s Pricing Calculator is an excellent tool for estimating cost. For example, there are a variety of options to save up to 38% on pay-as-you-go prices with 1-year or 3-year Azure Storage Reserved Capacity.
Additionally, be sure to explore costs of a variety of architecture options as you continue to refine the proposed architecture with the customer. Remember that this envisioning phase is more fluid, so having as many tangible options as possible would be beneficial to making the best decisions.
Once all of the costs and architectures are thoroughly vetted out, presenting the total anticipated monthly cost as clearly as possible would be a valuable deliverable from the envisioning phase.
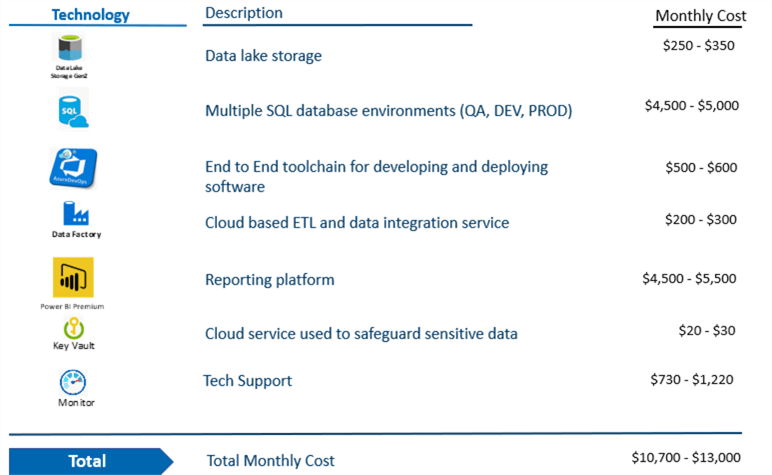
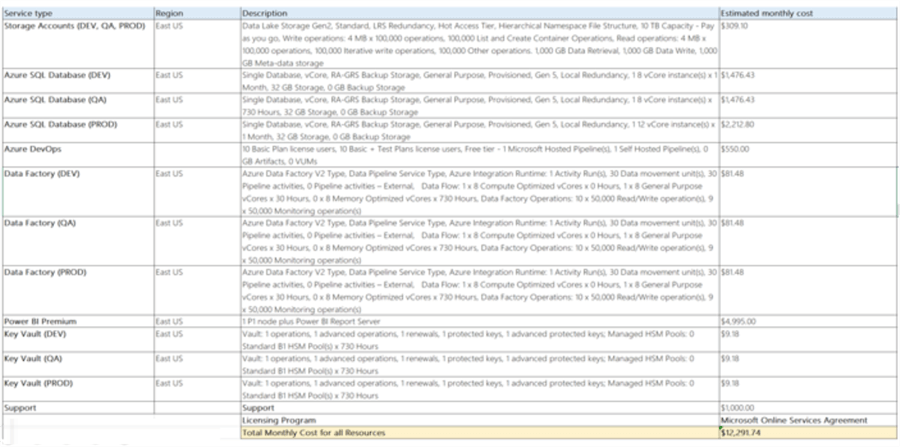
Cost Details
In addition to a high-level cost estimate, be sure to also include the detailed break-down of the service type, description and monthly cost which would further supplement and help with understanding the details of the estimated costs.
Implementing the Solution
So far, I have demonstrated a plan for designing a solution. Additional outputs from the envisioning phase might include a high-level implementation plan that includes a delivery timeline, sprint details, staffing profiles, and potential risks to effective delivery. The outputs presented and feedback received from this process would continue to help and guide the customer’s decision to embark on the next phase of implementing the proposed solution.
High Level Implementation Plan
A high-level implantation plan may include the following sample steps.
- Build and Configure IT infrastructure utilizing the Microsoft Azure environment.
- Establish data connections from source systems to data warehouse for both current and planned future data usage.
- Define & implement Master Data Management layer to govern cross-functional data interactions.
- Assess & develop initial cross-functional reporting enabled by data warehouse.
- Plan for future enhancements & implementations
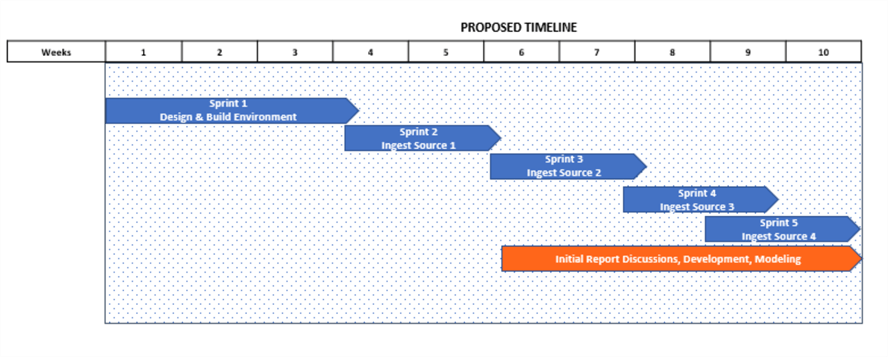
Delivery Timeline
It is critical to include a proposed delivery timeline as part of an implementation solution. A sample delivery timeline might look like the following where the sprints, high level deliverable tasks and timeline is clearly defined and outlined.
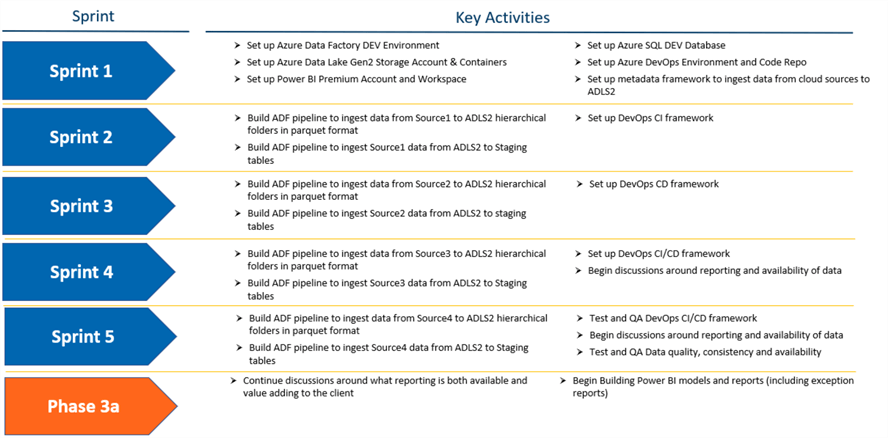
Sprint Details
Including a deeper level visual description of the sprint details and key activities to be performed in each sprint shows detailed value that will be delivered in each sprint.
Staffing Profile
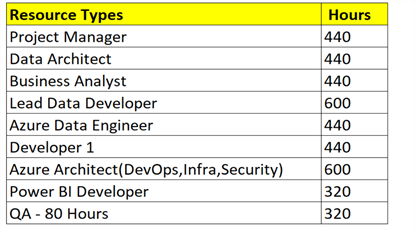
In addition to defining the delivery timeline, be sure to also create a staffing profile that defines the resource types and proposed hours through the course of the design (envisioning) and implementation phases. At a high level, the following roles would be key through the course of a cloud data platform and warehouse project. Note that the hours estimate also include hours dedicated for both Phase 1 (envisioning) and Phase 2 (implementation).
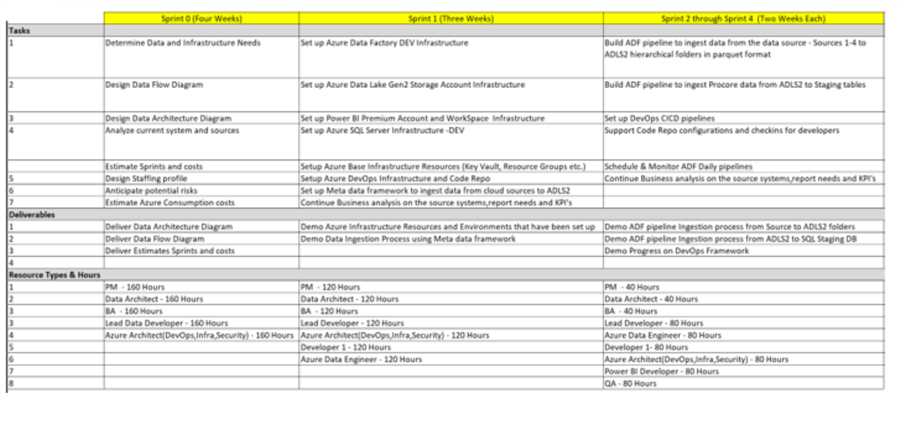
The illustration below could be used to further outline and define granular level details related to resources, hours and deliverables planned for Phase 1 (envisioning aka. Sprint 0) through Phase 2 (Sprint 1-4).
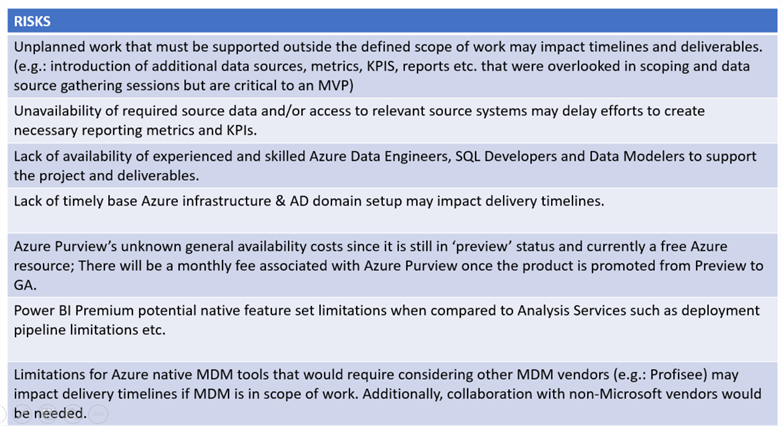
Potential Risks
As with any project, there are risks that need to be called out as far ahead of implementation as possible and this exercise of defining the potential risks is a critical one that must be presented as part of the envisioning phase deliverables.
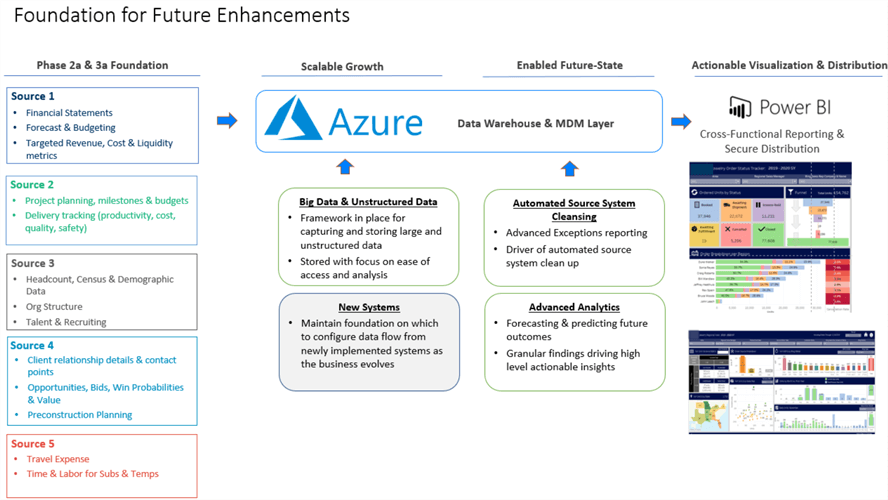
Future Enhancements
A foundational phase is merely the beginning of an organizations journey in the cloud. It is always a value-added step to include high level overviews of proposed future enhancements as a customer’s cloud maturity level increases and it is always helpful try and demonstrate this vision up-front to tangibly show the potential enhancements and evolution based on available data inputs.
Summary
Finally, at the end of Phase 1 (envisioning) it would be valuable to present an Executive Summary of work performed containing objectives and methodology along with proposed next steps which would include high level implantation plans, benefits, risks, timelines and costs.
Please see the below dashboard framework as reference for what a clear and concise Executive Summary might looks like. Presenting this Executive Summary along with all of the other detailed deliverables from Phase 1 (envisioning) that have been discussed in this article will champion the case for a cloud data platform and warehouse foundational build based on the detailed plans that would enable a seamless transition into Phase 2 (implementation).

Next Steps
- Read more about how to choose between Azure SQL DTUs and vCore for a SQL Database solution.
- Read more about Getting started with deployment pipelines for Power BI
- Understand how to implement capabilities that are native to Analysis Services in Power BI Premium by reading Setting up translations for datasets in Power BI premium.

Ron C. L’Esteve is a Data and AI Leader and professional Author residing in Chicago, IL, USA. He is well-known for his impactful books and article publications on Azure Data & AI Architecture, Engineering, and Leadership. Ron holds a Master of Business Administration (M.B.A.) and Master of Science in Corporate Finance (M.S.F.) from Loyola University Chicago. Ron possesses deep technical skills and experience in designing, implementing, leading, and delivering modern Azure Data & AI projects for numerous clients around the world. He is a Motorola Certified Six Sigma Green Belt, a Microsoft Global Challenger, and also holds numerous additional Microsoft, Snowflake, and Databricks professional certifications in Big Data Engineering, Artificial Intelligence, Apache Spark and Data Platform Architecture.
- MSSQLTips Awards: Champion (100+ tips) – 2023 | Author of the Year – 2020-2021 | Rookie of the Year – 2019