Problem
According to Gartner, small and medium businesses (SMB) usually have fewer than 999 employees. IT resources, such as budget and staff, are often highly constrained (Gartner, 2023). Ideally, a data warehouse project team should consist of professionals from people from various departments with diverse skills to assume different roles. However, sometimes, it is impractical for some SMBs to form such a project team. These SMBs, who use Microsoft products, seek a data warehouse architecture that allows a few software developers to build and maintain a data warehouse.
Solution
A data warehouse architecture describes a data flow from data sources to business users (Kimball et al., 2008). Due to the limitations of SMBs, we want to design a data warehouse architecture that allows us to build the data warehouse incrementally. In this way, we can create a comprehensive plan for a data warehouse and build it in iterations. During each iteration, we add sufficient features – not more, not less – to satisfy users while still following up on the data warehouse roadmap. Meanwhile, the data warehouse architecture is evolving along with the changes in business, technologies, and team members. Therefore, all components in the architecture should be replaceable. After many iterations, we will have a well-defined and mature data warehouse.
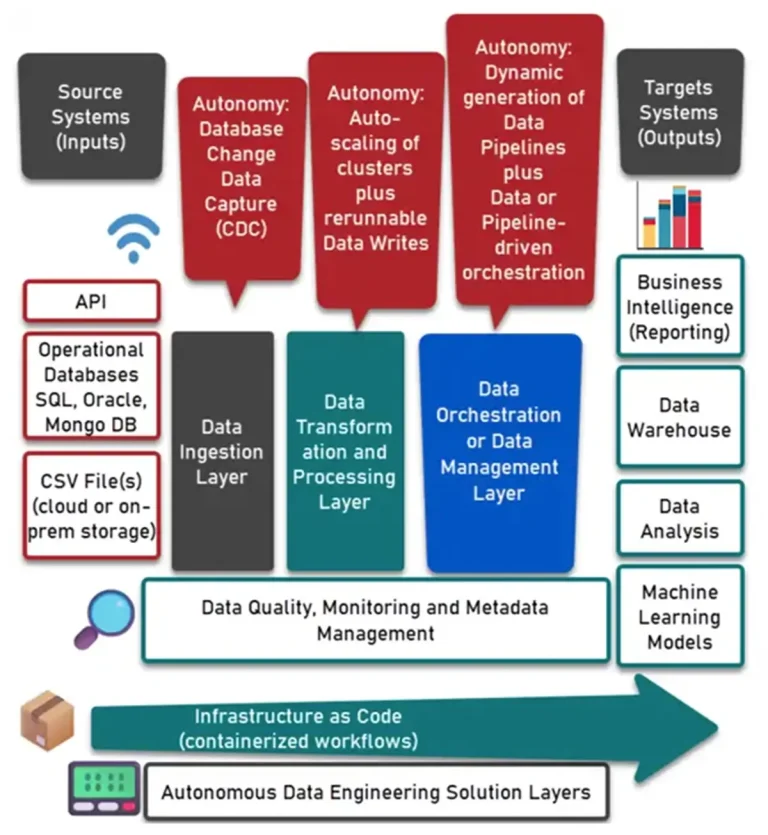
Inspired by Pandya and Shah's local data mart approach (Pandya & Shah, 2014) and reporting operational data stores (Kimball et al., 2008), we adopt a hybrid of the independent data marts (IDM) and the data mart bus architecture. Figure 1 demonstrates a high-level overview of the logical architecture. The logical model indicates that business users can access data landing areas and application data marts. At the same time, they can view data at a subject and enterprise level from integrated data marts. The architecture plan is not carved in stone. We should adapt to changes in the world and revisit the architecture plan frequently.

Figure 1 A high-level data warehouse technical architecture logical model
The logical model does not attempt to reflect the component's importance; instead, the model illustrates the arrangement of these components. The proposed logical model contains eight components:
(1) Data Transfer Services: Transfer files from data sources (including production data, internal data, archived data, and external data) to the data warehouse environment.
(2) Data Landing Area: Serves as the initial dropping-off point for incoming data (Schraml, 2020).
(3) Data Extracting Services: Denormalize data in the data landing area and then load it to a relational database.
(4) Application Data Marts: Contain the denormalized data at the application level.
(5) ELT Services: Perform data extraction, loading, and transformation to produce integrated subject-oriented data.
(6) Integrated Data Marts: Contain the subject-oriented data.
(7) Security: Proactively protects information from unauthorized access.
(8) Metadata: Acts as a table of contents for the data in the data warehouse, which assists users in understanding the content and finding data.
A data warehouse project is people-intensive (Ponnian, 2001). Due to lacking IT resources, we start with a simple architecture and let the business drive the data warehouse. Eventually, the data warehouse becomes mature and can consolidate relevant data from various sources. Even though we use Kimball's approach to design the architecture, there are some differences between Kimball’s approach and ours:
(1) Kimball’s approach actively interviews business users to collect rules. In contrast, our approach passively waits for business users to tell us what they need.
(2) Kimball’s approach begins with a single business process, while ours starts with a single business process in an operational application.
(3) When loading data to application data marts, we very likely do not perform data cleansing and transformation because business rules may be unknown. However, business users can analyze this data because self-service BI tools can process data effectively nowadays.
(4) We conditionally allow business users to access the “back room,” i.e., the data landing area and the application data marts. On the contrary, Kimball's approach only allows business users to access the “front room” presentation area.
Every business has particular requirements and resources; therefore, the data warehouse architecture varies from business to business. In this tip, we first briefly introduce the process and principal components of building a data warehouse. Then, the article explores five predominant architectures. As these architectures evolve, they become more similar (Ariyachandra & Watson, 2006). For example, Kimball’s and Inmon’s approaches agree that presentation layer data should be in the dimensional model (George & Jeyakumar, 2019).
1 – Building a Data Warehouse
Software developers at SMBs may have limited knowledge and experience building a data warehouse. Therefore, when launching a data warehouse project, they should perceive a radical change in their roles and adjust their mindsets about building applications. For example, they may get used to developing applications or reports for providing information to business users. In contrast, the data warehouse project asks them to create an information delivery system allowing business users to access data independently (Ponnian, 2001). To build a successful data warehouse, they should clearly understand that both the users and the business drive the development, and they should be humble in the presence of business users (Kimball et al., 2008).
We can employ Kimball’s “plan big, build small” approach when working on a data warehouse project. Therefore, the initial project implements only a small portion of the data warehouse project. Rather than reinventing the wheel, we use the Kimball Lifecycle framework to guide every step in building a successful data warehouse. The framework provides a clear picture of the data warehouse development lifecycle.
1.1 Planning the Data Warehouse Project
A data warehouse project begins with the preparation of a project plan. We first should evaluate the readiness for the data warehouse project. We need to ensure that the company needs a data warehouse and that top management has realized that a data warehouse can help solve business problems. Otherwise, a data warehouse project is likely to fail when it does not have business sponsors. In addition, a data-driven decision-making culture in the company also leads to building a successful data warehouse.
Even though we want to build a large, enterprise-wide data warehouse, we should implement a small portion in the initial iteration. In this case, we have a clear goal and realistic expectations. For example, the initial data warehouse project aims to create a few application data marts. With this project scope, we can staff the project, estimate the project timeline, and get approval from senior management.
1.2 Collecting Business Requirements
Business users and requirements, not developers and technology, drive the data warehouse project. Therefore, developers should resist the temptation to build fancy components exploiting the depths of technology. Instead, they need to concentrate on the information that business users need (Ponnian, 2001). Ideally, we should have precise business requirements before data warehouse design and implementation. However, the world of business is changing rapidly. As a result, the way of using the information in the data warehouse is unpredictable. Business users cannot visualize the requirements for the data warehouse before they use it. On the other hand, the data warehouse team at an SMB may not be able to arrange many interviews with business users to collect requirements.
However, business requirements are the primary guide to the data warehousing project, and we should have a broad understanding of the business to build a data warehouse. We can gather high-level business requirements from the industry's best practices. The company's internal reports and documents are another valuable resource for discovering business requirements. In addition, the operational data can help explain the business processes and indicate some measures of business performance.
Moreover, managers tend to consider business performance measurements with respect to business dimensions (Ponnian, 2001). They know what numeric numbers can indicate business success. Then, they ask what factors influence these numbers. For example, a sales manager at Adventure Works Cycles (Microsoft, 2022) is interested in the sales revenue by product category in a particular month and by promotion in a specific sales territory. Product category, month, promotion, and sales territory are business dimensions, and sales revenue is the numeric number to measure sales performance. We can determine detailed business requirements for a data warehouse with dimensional analysis.
1.3 Data Warehouse Architecture
We use a data warehouse architecture, which represents a data warehouse’s overall design and structure, to explain how we implement the business requirements. Business requirements are the primary guide in designing a data warehouse architecture. Since each company may have unique business requirements, a data warehouse architecture could vary from company to company. However, a data warehouse architecture should have the following properties (IntecrviewBit, 2023):
- Separation: Analytical and transactional processing should be disconnected.
- Scalability: With the increase in data volume and the number of users, the data warehouse should be able to process data with the minimum impact on the existing infrastructure.
- Extensibility: The architecture should be able to handle changes in the world and provide new features to business users without redesigning the whole system.
- Security: Every component in the architecture should implement security strategies.
- Administrability: Data Warehouse management should be straightforward.
There are many types of data warehouse architecture. However, we can categorize them into two fundamental groups: the hub-and-spoke architecture and the data mart bus architecture. Bill Inmon and Ralph Kimball are pioneers in data warehouse development, and they advocate these two architectural approaches, respectively. Both approaches have been equally successful in past decades for their intended purposes (Rangarajan, 2016). However, when a company is willing to adopt the “plan big, build small” strategy, we recommend using the data mart bus architecture, i.e., Kimball’s approach.
1.4 Database Design and Implementation
Business users may naturally think of business metrics in terms of business dimensions and analyze metrics along such dimensions. Therefore, a proposed data model should include these business dimensions and metrics. We can use the dimensional modeling technique to design the data model. A dimensional data model is structured to deliver maximum query performance and ease of use. A typical dimensional model consists of a fact table surrounded by dimension tables. This data structure is often called a star schema (Zhou, 2020).
A data warehouse consolidates relevant data from various sources, and the original data may be in different formats. To simplify the database design, we classify the data into three categories (Moody & Kortink, 2003):
- Transaction Entities: Record the output of a single business process. The output contains metrics(for example, sales revenue) that measure performance. The entities should also contain attributes (for example, sales territory) that describe and define the process.
- Component Entities: Describe and define the business process. They answer who, what, when, where, how, and why questions about the process.
- Classification Entities: Classify a component entity, for example, ProductCategory and ProductSubcategory. These entities can define hierarchies in the data model for drilling down or rolling up in data analysis. Besides, they can categorize a component entity.
After classifying entities, we can design the star schema. We designate transaction entities as fact tables and component entities as dimension tables. We usually collapse classification entities into component entities to obtain flat dimension tables with single-part keys that connect directly to the fact table. Fact tables should be in 3NF, and dimension tables are usually in 2NF and possibly in 3NF, but they cannot be in 1NF. It is worth noting that a transaction entity to a fact table mapping is not always one-to-one, and the correspondence between component entities and dimensions is also not always one-to-one.
We usually create conceptual, logical, and physical models when designing and implementing a database. First, we create a conceptual data model and then work on a logical one. Finally, we produce a physical data model after the logical data model is approved. However, in a data warehouse project, the conceptual and logical data models are sometimes considered a single deliverable (Zhou 2018).
1.5 ELT Design and Implementation
The copies of raw data are in the data landing area, and the destination is the data marts, which have a collection of database tables in 2NF or 3NF. Typically, developers use the Extract, Transform, and Load (ETL) system to transport data from the landing area to data marts. According to Kimball, building an ETL system may consume 70 percent of the time and effort of building a DW/BI environment (Kimball et al., 2008). Simply put, an ETL system performs these three tasks sequentially:
- Extraction: Extracts data from various sources, including structured and unstructured data, into a consolidated, consistent data structure.
- Transformation: Applies business rules and reshapes data into useful information. This task may include deduplication, standardization, aggregation, discretization, generalization, integration, and cleansing.
- Loading: Moves data to a target data warehouse. Typically, there are two ways of loading: full refresh and incremental load. We usually use the full refresh approach to load component entities. This method truncates the database tables and then loads all data. The incremental load method loads the delta (or difference) between the data source and destination.
However, the proposed architecture in this article uses a different system, i.e., ELT or Extract, Load, Transform. We extract the data and load it into the warehouse immediately. The new set of data structures, not a dimensional model yet, adds some capabilities to the original structures and brings value to the business users for various analytical purposes. In this case, we do not transform data until business users analyze data and seek accurate data in specific structures. Then, we have their business requirements and add functions to the data transformation layer. In addition, today, BI self-service tools are powerful and can perform data transformation on-the-fly.
1.6 Deployment
We should have development, test, and acceptance environments to build a data warehouse. By reaching the deployment phase, we complete testing all functions that the data warehouse can provide. We should let business users run tests in the acceptance environment. They use all their tools to perform data analysis and compare analysis results from the operating systems to the results from the data warehouse. They can evaluate the complexities and performance of queries. We can only deploy the data warehouse to the production environment when business users are satisfied with the test results. We should invite users from different groups to test the data warehouse. While they are testing data, we are testing security. The data warehouse should only allow users to view data they can access.
A data warehouse is a blend of many technologies and components. The initial project should deploy all components; therefore, we adopt the divide-and-conquer strategy. We can pack the deployment into manageable parts and deploy them independently with a deployment plan. In the subsequent projects, we can use this plan as a checklist. We also should develop a backup and recovery plan to ensure disaster recovery readiness.
1.7 Maintenance
Our strategy is to plan big and build small. We anticipate that business users will tell us what they need. If a data warehouse does not bring value to business users, they walk away and seek alternative solutions. Eventually, a data warehouse becomes a data basement. Therefore, maintaining a healthy data warehouse is critical to building a successful one. The hardware and software resources usually provide statistics to show utilization information. Besides, business users bring us their comments and requirements. Therefore, collecting statistics and maintaining healthy relationships with business users are essential to maintaining a data warehouse. In addition, data access management is routine maintenance.
Future iterations will add new data marts to the data warehouse in future iterations. Likely, we will retire some data marts. We should, therefore, keep business users posted and help update their queries accordingly. On the other hand, conformed dimensions are a fundamental element of the Kimball approach. We can knit star schemas together through conformed dimensions: we should use conformed dimensions whenever we can. When integrating dimensions from multiple sources to a conformed dimension, we should notify the development team and business users. We should track the changes in the data warehouse and provide the data warehouse community with up-to-date documents.
2 – Data Warehouse Architecture Comparison
We usually apply two classification methods to classify data warehouse architectures. The first method uses an N-tier architecture to describe a data warehouse architecture. This method divides a data warehouse into logical layers and physical tiers. For example, a data warehouse often uses a three-tier architecture (Han et al., 2012). Some data warehouse practitioners adopt a Five-Layered Business Intelligence Architecture (Ong et al., 2008).
The second classification method (adopted in this article) characterizes the arrangement of individual components, particularly those data storages: central repository and data marts. There are five commonly recognized architectural styles: Independent Data Marts, Data Mart Buses, Hub-and-Spoke, Centralized Data Warehouses, and Federated (Singh & Malhotra, 2011). There are other architectures, but they tend to be variations of these five. For example, the data vault model (DVM), invented by Dan Linstedt, is hub-and-spoke based (Inmon et al., 2019). It is worth noting that Bill Inmon favored the hub-and-spoke architecture (e.g., the Corporate Information Factory), while Kimball advocated the data mart bus architecture.
2.1 Independent Data Marts
A data mart is a subset of a data warehouse, usually consisting of a single subject area (for example, finance, human resource, and marketing). An independent data mart is a small warehouse designed for individual units or particular applications. We can create independent data marts at a lower cost and within a shorter time. However, because of their independence, they may have inconsistent data and may not provide “a single version of the truth,” making it difficult to analyze data at the company level. Figure 2 illustrates the independent data mart architecture.
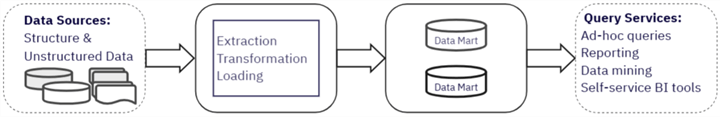
Figure 2 Independent Data Mart Architecture
2.2 Data Mart Bus
Kimball created the data mart bus architecture in the 1990s by offering an innovative approach to building a data warehouse. This architecture, as shown in Figure 3, is based on dimensional modeling, which involves these concepts: dimensions, facts, conformed dimensions, and bus matrix. A fact table and dimensions construct a star schema, forming a data mart. A union of all the well-defined data marts constructs a corporate data warehouse. The BUS (i.e., the conformed dimensions) facilitates communication between these data marts.
We call the approach of adopting this architecture bottom-up or user-driven. This architecture allows us to build a data warehouse incrementally. For example, we build the first data mart for a single business process. We then look at other processes and build more data marts. In each iteration, we perform a conforming process to create conformed dimensions. Additional marts should use these conformed dimensions, which results in logically integrated marts and an enterprise view of the data.

Figure 3 Data Mart Bus Architecture
2.3 Hub-and-Spoke
The hub-and-spoke architecture, as shown in Figure 4, includes a centralized data warehouse (highly normalized and often in 3NF) and several department data marts. We physically separate the central data repository and data marts. These data marts are dependent data marts because we create them from the centralized data warehouse. Bill Inmon, the “father of data warehouse,” advocated this architecture.
We call the approach of using this architecture the top-down or data-driven approach. We create a centralized data repository, gather data from sources, transform it, and load it into the repository without knowing the end user criteria or requirements. We then break data down into data marts to meet the needs of different business groups.
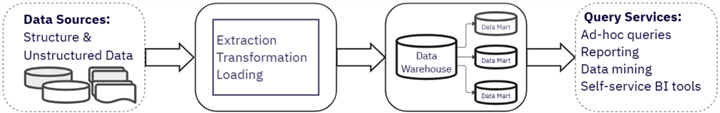
Figure 4 The Hub-and-Spoke Architecture
2.4 Centralized Data Warehouse
The centralized data warehouse architecture, as shown in Figure 5, is similar to the hub-and-spoke architecture but without dependent data marts. Users access the gigantic enterprise data warehouse.
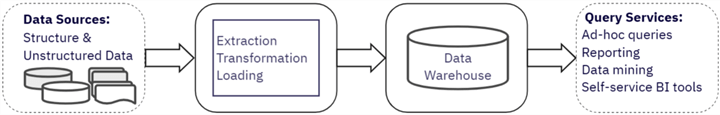
Figure 5 The Centralized Data Warehouse Architecture
2.5 Federated
A big company may be composed of several regional divisions, each having built a data warehouse. On the other hand, a company may have several data warehouses built for different functions or applications. In this case, we can use a federated architecture, as shown in Figure 6, to integrate at least some of the data. In a federated architecture, we do not change existing data repositories; business users can access these repositories when needed. Meanwhile, we can use shared keys, global metadata, distributed queries, and other methods to integrate data logically or physically (Alsqour et al., 2012).

Figure 6 The Federated Architecture
The selection of data warehouse architecture critically impacts the project plan and implementation (Dymek et al., 2015). If resources are limited, we can start with independent data marts and then let business requirements drive the evolution of the architecture. Independent data marts may serve business users sufficiently if they only want to perform descriptive analysis to answer what happened. However, when users perform advanced analyses (such as diagnostic, predictive, and prescriptive analyses), they may need data at the company level. The architecture proposed in this article is a hybrid of the independent marts and data mart bus architectures, which can satisfy different levels of business analysis.
Summary
A data warehouse is a copy of transactional data specifically structured for query and analysis (Kimball & Ross, 1996). A data warehouse can help business to make decisions. Adopting an appropriate architecture is critical to building a successful data warehouse. This article proposes an architecture for small and medium companies with highly constrained IT resources. The proposed architecture allows us to implement Kimball’s “plan big, build small” strategy. In addition, the architecture allows developers to deploy a new data mart at a lower cost and within a shorter time.
We started with the proposed data warehouse architecture. Next, we compared our architecture to Kimball’s architecture. We made the point that we could start with a simple architecture and let the business drive the data warehouse evolution. We then explored seven significant components of building a data warehouse. Next, we briefly covered the five predominant architectures. These architectures are not mutually exclusive. Our architecture is evolving, and it is possible to use components from other architectures and arrange them similarly to the others.
Reference
Alsqour, M., Matouk, K. & Owoc, Mieczyslaw. (2012). A survey of data warehouse architectures — Preliminary results. 2012 Federated Conference on Computer Science and Information Systems, FedCSIS 2012. 1121-1126.
Ariyachandra, T. & Watson, J. H. (2006). Which data warehouse architecture is most successful? Business Intelligence Journal 11 (1): 4.
Dymek, D., Szwed, P. & Komnata, W. (2015). Proposal of a New Data Warehouse Architecture Reference Model. https://www.researchgate.net/publication/277476655
Gartner (2023). Small And Midsize Business (SMB). https://www.gartner.com/en/information-technology/glossary/smbs-small-and-midsize-businesses.
George, J. & Jeyakumar, K. M. (2019). A Comparative Study of Data Warehouse Architectures: Top Down Vs Bottom Up. IJSTE, Volume 5, Issue 9, 008.
Han, J., Kamber, M. & Pei, j. (2012). Data Mining Concepts and Techniques. Waltham, MA: Morgan Kaufmann.
Inmon, H. W.H., Linstedt, D. & Levins, M. (2019). Data Architecture: A Primer for the Data Scientist, 2nd Edition. Cambridge, MA: Academic Press.
IntecrviewBit. (2023). Data Warehouse Architecture – Detailed Explanation. https://www.interviewbit.com/blog/data-warehouse-architecture/.
Kimball, R., Ross, M, Thornthwaite, Mundy, J. & Becker, B. (2008). The Data Warehouse Lifecycle Toolkit. Hoboken, NJ: John Wiley & Sons.
Kimball, R. & Ross, M. (1996). The Data Warehouse Toolkit. Hoboken, NJ: John Wiley & Sons.
Microsoft. (2022). Analysis Services Tutorial Scenario. https://learn.microsoft.com/en-us/analysis-services/multidimensional-tutorial/analysis-services-tutorial-scenario.
Moody D. L., and Kortink M. A. R., From ER Models to Dimensional Models: Bridging the Gap between OLTP and OLAP Design, Journal of Business Intelligence, vol. 8, 2003.
Ong, L. I., Siew, H. P. & Wong, F. S. (2011). A Five-Layered Business Intelligence Architecture. Vol. 2011 (2011), Article ID 695619, Communications of the IBIMA: IBIMA Publishing.
Pandya, B & Shah, S. (2014). Proposed Local Data Mart Approach for Data Warehouse Architecture. IJETAE, Volume 4, Issue 2.
Ponnian, P. (2001). Data Warehousing Fundamentals: A Comprehensive Guide for IT Professionals. Hoboken, NJ: Wiley InterScience.
Rangarajan, s. (2016). Data Warehouse Design – Inmon versus Kimball. https://tdan.com/data-warehouse-design-inmon-versus-kimball/20300
Schraml, T. (2020). Staging Versus Landing Areas in Analytics Environments. https://www.dbta.com/Columns/Database-Elaborations/Staging-Versus-Landing-Areas-in-Analytics-Environments-143425.aspx
Singh, S. & Malhotra, S. (2011). Data Warehouse and Its Methods. Journal of Global Research in Computer Science, Volume 2 No (5), May 2011.
Yessad, L. & Labiod, A. (2016). Comparative study of data warehouses modeling approaches: Inmon, Kimball and Data Vault. 2016 International Conference on System Reliability and Science (ICSRS), Paris, France, 2016, pp. 95-99, doi: 10.1109/ICSRS.2016.7815845.
Zhou, N. (2018). Create a Star Schema Data Model in SQL Server using the Microsoft Toolset. https://www.mssqltips.com/sqlservertip/5614/explore-the-role-of-normal-forms-in-dimensional-modeling/.
Zhou, N. (2020). Explore the Role of Normal Forms in Dimensional Modeling. https://www.mssqltips.com/sqlservertip/5614/explore-the-role-of-normal-forms-in-dimensional-modeling/.
Next Steps
- A data warehouse is a blend of technologies and components. The article only covered some basics of building a data warehouse. The high-level data warehouse technical architecture logical model proposed in this article can guide the creation of a layered data warehouse architecture, which includes detailed architecture design. The author recommends creating a simple architecture when a software developer needs to build a data warehouse. Then, the developer can read Ponniah’s book “Data Warehousing Fundamentals for IT Professionals” to learn data warehousing principles. Next, they can read Kimball’s books, for example, “The Data Warehouse Lifecycle Toolkit,” “The Data Warehouse Toolkit,” and “The Data Warehouse ETL Toolkit” in sequence.
- Check out these related tips:
- Create a Star Schema Data Model in SQL Server using the Microsoft Toolset
- Explore the Role of Normal Forms in Dimensional Modeling
- What is a Relational Database Management System
- Create an Extended Date Dimension for a SQL Server Data Warehouse
- Loading Historical Data into a SQL Server Data Warehouse
- How to use Factless Fact Tables in a Data Warehouse Business Intelligence Solution
- Infrastructure Planning for a SQL Server Data Warehouse
- Surrogate Key vs Natural Key Differences and When to Use in SQL Server

Nai Biao Zhou has twenty years of experience in software development, with strong analytical skills and a broad range of computer expertise.
He has fifteen years of experience in development and maintenance of database applications on SQL Server in OLTP/OLAP/BI environments.
He has a master’s degree in Control Engineering and is pursuing a Master of Science degree in Predictive Analytics.
Knowledge/Skills
Advanced computer programming skills and well versed with C/C#, Java, ASP.NET, JavaScript, and SQL.
In depth knowledge of Solution Architecture, and Software Development Life Cycle (SDLC).
Microsoft Certified Application Developer (MCAD) since 2004.
- MSSQLTips Awards: Author of the Year – 2021 | Rising Star (50+ tips) – 2024 | Author Contender – 2020, 2023