Problem
Imagine that you need to obtain advanced insights over a dataset, and for example, over a text dataset, provide a report that includes key phrases, sentiment of the text (if it is positive or negative) and the language of the text written. This type of report will be used to determine what users think about the company and the main language of the users, so we can target efforts on addressing issues with more clear insights. Developing this analysis from scratch will take an exceptionally long time and might not have the desired results, so we need to use an existing service that provides these features.
Not too long ago, if we wanted to implement these features in Power BI, we had to manually create and add the functions from Azure services, as discussed here, now these features are included in the Power BI service. In this tip we will discuss how to use these features and build a report.
Solution
With the help of Power BI and its ability to create stunning reports from different sources, and now with the built-in AI Insights feature, we can get powerful insights in minutes, without having to write functions or code API calls.
What are Power BI AI Insights?
Power BI AI Insights is a feature that contains a collection of pre-trained Artificial Intelligence models that can help you implement better data insights with little effort.
Note: to use AI insights feature it requires a Power BI premium capacity. If you enable the Power BI pro time trial, you can test and learn this feature. You can learn more about Power BI premium here.
It consists of three functions:
- Text Analytics: Pre-built models for text analysis (Detect language, Score sentiment, Key phrases).
- Vision: Pre-built model for tagging images.
- Azure Machine learning: It allows the use of Azure ML models, you can read more here.
How to Enable AI insights?
As we discussed earlier, it requires premium capacity to be used.
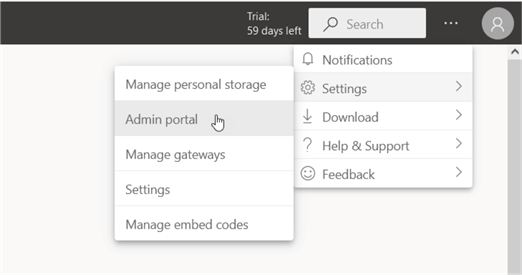
You can check this in the Power BI service at app.powerbi.com, then go to Settings > Admin Portal.
Once on Admin Portal, go to Capacity Settings.

You can Purchase premium capacity here if needed and if you already have it, the capacity options will display here. You can learn more about Power BI premium here.
To use this, you must be in the Power BI query editor, and then go to Home > AI Insights, we will see an example in a moment.

Using AI Insights
We will see a Text Analytics example using a SQL Database dataset.
I have created a table called Articles, that contains random wiki articles in different languages as we can see in the image:

We will use the Text Analytics to detect language and obtain key phrases.
The first step is to load the dataset into Power BI, we can do this by creating a new report or by adding a new dataset with the Get Data option:
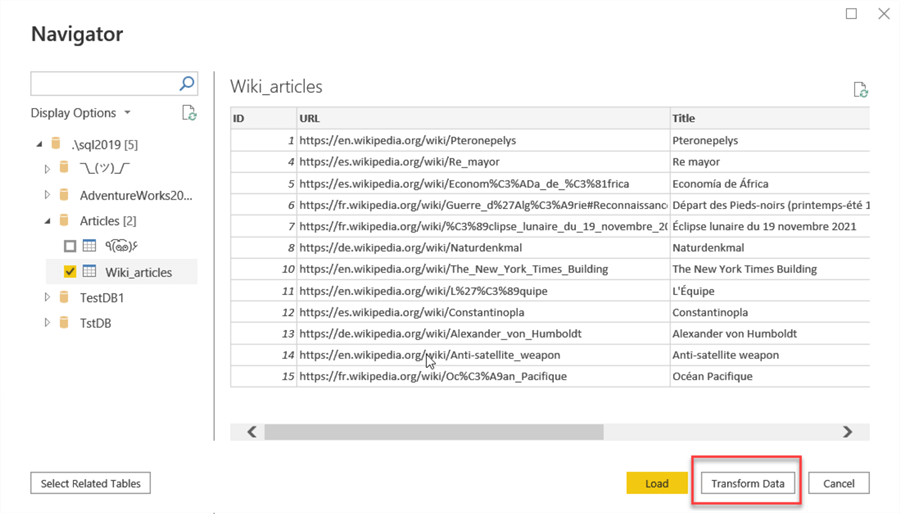
When loading, use the Transform Data option, so we can access Power Query in the same step:

Optionally you can apply your usual cleanup or data transformation steps, for my example I will remove URL since we will not use it for this example:

Next step is to add the text insight functions.
Select the column you want to detect the language (for this example, the contents column) and then go to AI insights and select Text Analytics:

If you are already logged in, it will display the available functions. Let us start with Language Detection.
Verify that the column you want to check is select in the dropdown box. For the premium capacity option, leave the default, then click OK.

You must agree with the privacy levels before continuing:

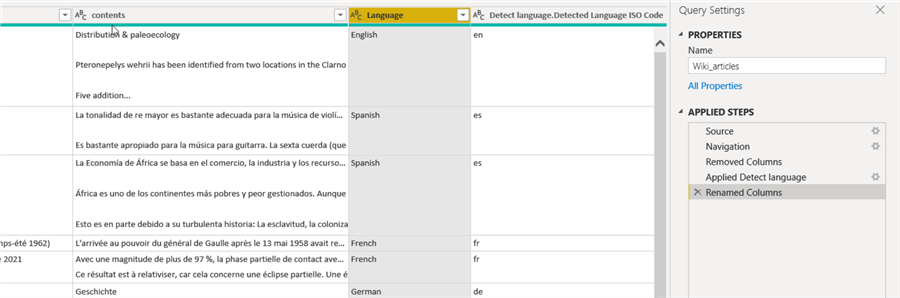
Two new columns will be added, Language Name and ISO Code:
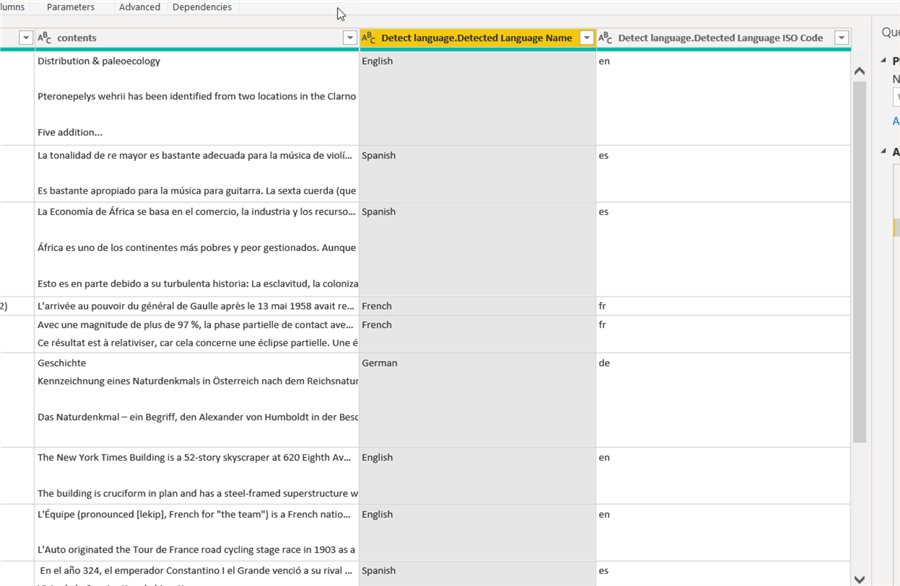
You can see that the column names are very lengthy, so you can change them if you want, in my case, I will renamed the Detect language.Detected Language Name column.
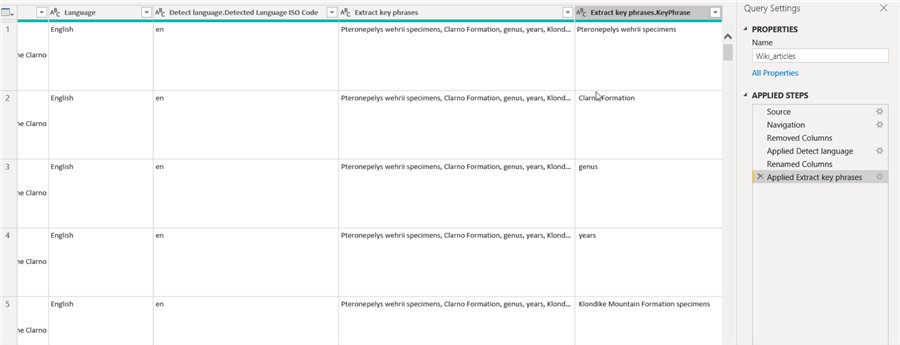
Now we will extract the key phrases, so we select again AI insights and Text Analytics, then we select Extract Key Phrases.
Make sure the contents column is selected for text, and the ISO code from the previous step:

Then click on OK, please be aware that this transformation will take a lot of time to complete depending on the text size, since a new row will be added for each key phrase (we will check how can we remove this later):
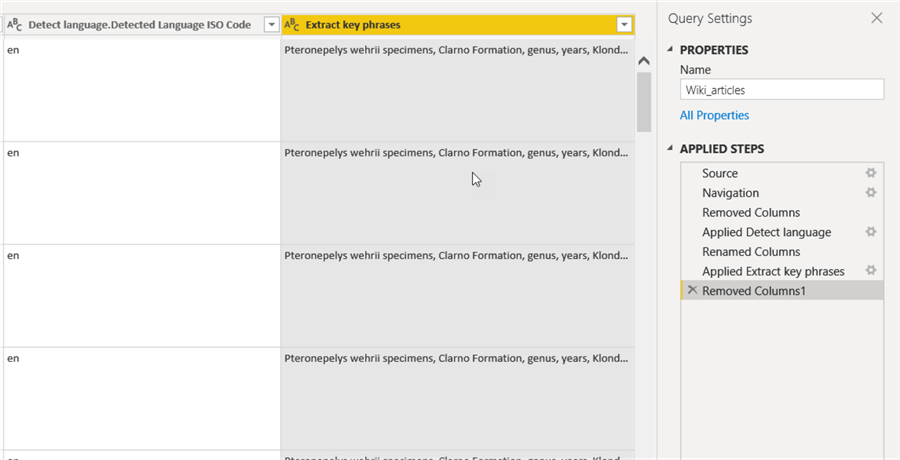
If you want to remove the extra rows and just leave the Key Phrases column, you can follow these steps:
Remove the individual key phrases by removing Extract key phrases.KeyPhrase column:
Then remove duplicated rows, based on ID column:
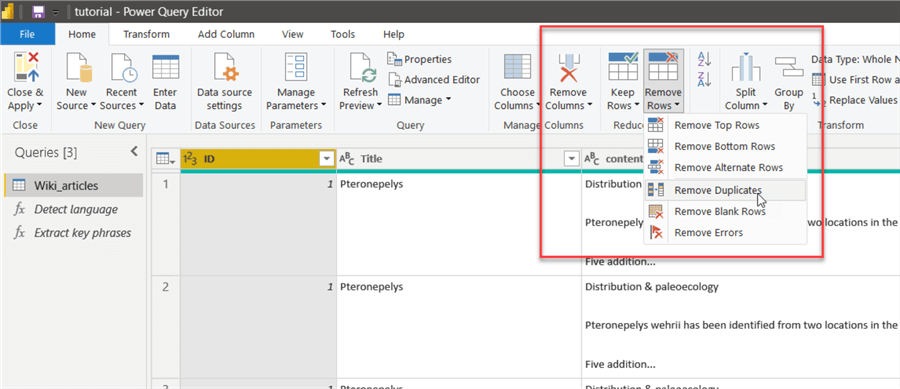
Now you can see that only one row for all key phrases is kept:

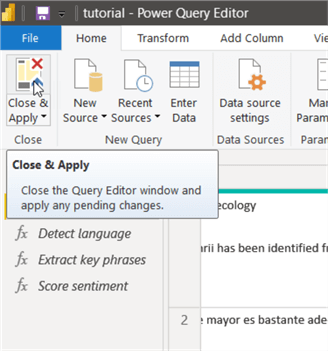
At this point we have what we need to add some visualizations. You can continue with your data preparation if you want, and once you are done, click on Close & Apply:
Once the data is processed you can add your visuals, here you can do anything you want, so let us start by adding a table with the article title and its language using a table visual:

Next, let us add another visual to check the number of articles by language, you can use the visual you like. For this example, I will use a Funnel visual, with a gradient color:

To see key phrases, we can add a word cloud visualization, is not by default on the visualizations list, but is easy to add it.
To add it, go to visualizations, and click on the three dots, then on Get more visuals:

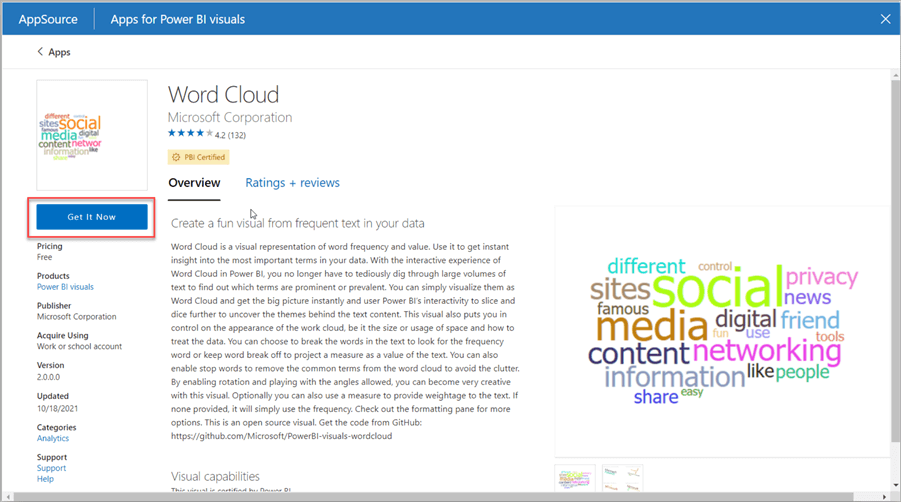
In the Power BI visuals, select Word Cloud:

Then click on Get It Now:
Once loaded, you can add the visual, we select the key phrases column for this visual:

At this point, you can select any language to highlight the other visuals:

You can add more visuals on other pages if you like, for example I added a matrix visual on a new page to show key phrases by language:

Once you are ok with your design you can publish your report.
In this tip we saw how the text AI insights works. The vision insight works the same way, but with columns containing images. You can experiment with different datasets to check how these work.
Next Steps
- Get the latest release of Power BI desktop here.
- You can check Microsoft official documentation on Power BI architecture here.
- You can check AI Insights documentation here.
- You can read more Power BI tips here.

Eduardo Pivaral is an MCSA, SQL Server Database Administrator and Developer with over 15 years of experience working in large environments.
- MSSQLTips Awards: Trendsetter (25+ tips) – 2020 | Author of the Year Contender – 2019 | Rookie of the Year – 2018


