By: Mohammed Moinudheen | Updated: 2021-12-22 | Comments (2) | Related: > Azure Data Studio
Problem
I have Azure Data Studio available and there is a performance issue reported on one of the SQL Servers supported. Is there any way by which I can make use of Azure Data Studio to monitor the performance issues on this server?
Solution
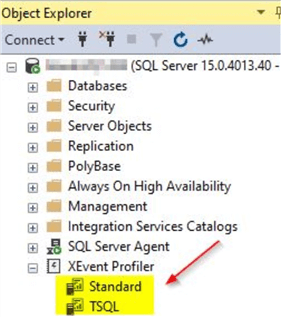
Using SQL Server Management Studio (SSMS), we can easily use extended events as simply as just clicking the option to 'Launch Session' to collect performance data as shown in the screenshot below.
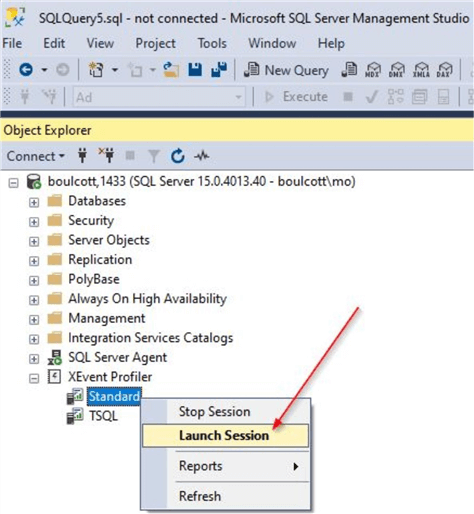
Before using Extended Events, SQL Profiler was quite commonly used. However, it is not recommended to be use any longer due to issues around performance while using it. SQL Server Profiler is a graphical tool and it generally collects more information than required and on a heavily used production system, using this can cause considerable performance issues. Due to these risks, it is not advisable to run it on production servers any more. Moreover, SQL Profiler is considered a deprecated feature and may not be available in future releases.
Azure Data Studio as such does not have this tool in the base install, but it can be downloaded as an extension. The good news is that even though the extension is known as 'SQL Server Profiler' in Azure Data Studio, under the hood it is making use of Extended Events. So, it is very much light weight with very low resource requirements.
Installing Azure Data Studio
Starting with SQL Server Management Studio (SSMS) 18.7, Azure Data Studio is automatically part of the install and you don't have to perform any additional installations. However, you can also install Azure Data Studio separately from this link, if you don't already have SSMS installed. Also, as Azure Data Studio is available on various platforms, make sure to download and install the installer file for the correct operating system – Windows, macOS or Linux.
From within SSMS, you can view the option to use Azure Data Studio as shown.

How to use SQL Server Profiler on Azure Data Studio
You can make use of extensions that are available in Azure Data Studio. There is an extension known as the 'SQL Server Profiler' specifically for this purpose. Either you can download this separately or this extension is also available when you install the extension known as the 'Admin Pack for SQL Server'.
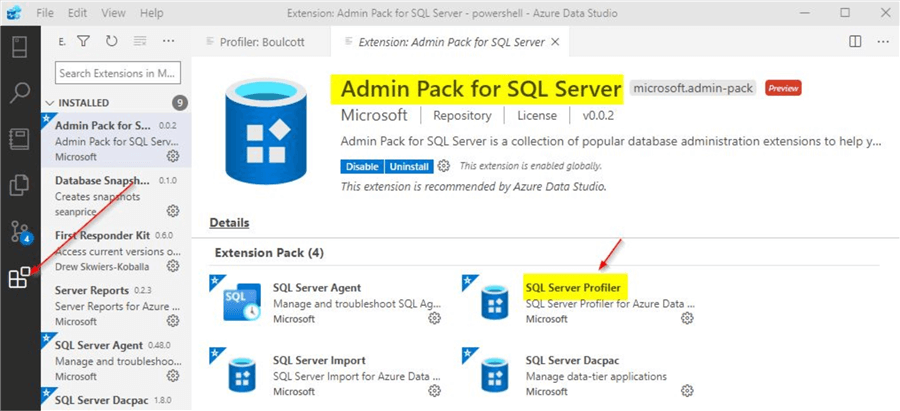
As you can see the 'SQL Server Profiler' is available when you install the 'Admin Pack for SQL Server' extension. If you just want to install the 'SQL Server Profiler', it is available separately as well.

As you can see, the process to install this extension is simple and straight forward and can be done in a few easy steps.
Using SQL Server Profiler on Azure Data Studio
In order to launch Profiler, you can do so from the 'Command Palette' as shown or use the relevant shortcut keys (Alt + P).

Once on the 'Command Palette', you can use the option to launch the profiler as shown.

When you click on the option to 'Launch Profiler', you will see this screen where you can provide details of your server.
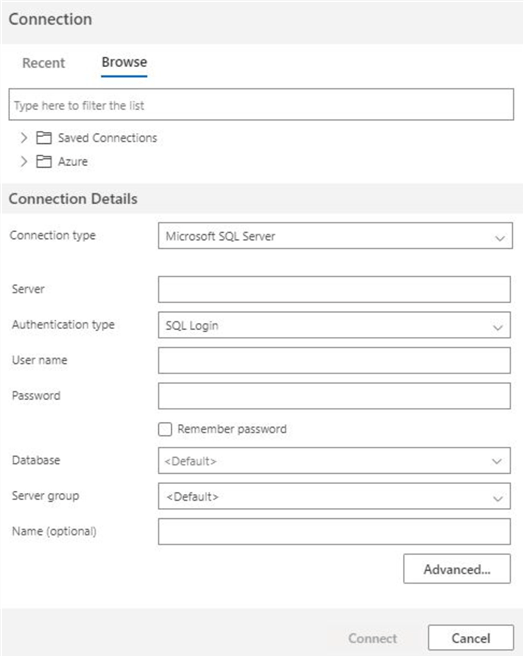
Provide the server details and click on the 'Connect' option. Once done, you will see this option.
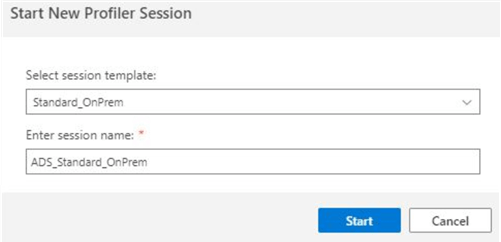
If you check the session templates available, you will see these two options.
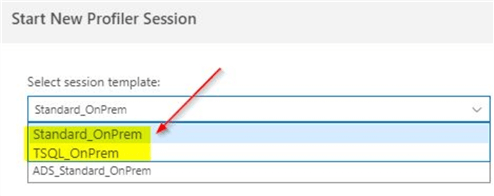
The server we are trying to connect to is an on-premises server. If you check closely, this is the same options available when you try to start extended events using SSMS.
Starting the profiler session on Azure Data Studio
You can select the session template based on your requirement and click on the option to start the profiler session. This will start the profiler session and you will be able to see in real time the session activity as shown.

You can review the section highlighted yellow where you can view additional options available to use. There are various view options that can be used. You can select the option of your choice to view the session activity.

The filter option is quite useful to collect activity based on the database you wish to monitor or any other specific filter option you wish to add.
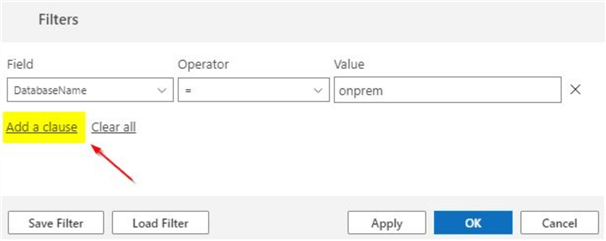
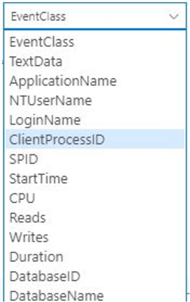
Here, you can see that the session activity is filtered by 'DatabaseName'. You can add additional clauses based on your requirement. There are a number of additional filter clauses that are available as shown in the screenshot below.
Clearing all the filters is easy as there is an option available within the template as shown.

Once you are fine with the session activity collected, you can stop the profiler using the [Stop] option which is in red.
Viewing data collected on Azure Data Studio
You will be able to view the data collection in real time. It will help if you apply the correct filter clauses as shown earlier to focus on the correct information and eliminate unwanted noise. You can review the code quite easily by clicking on the relevant rows and viewing additional information as shown.
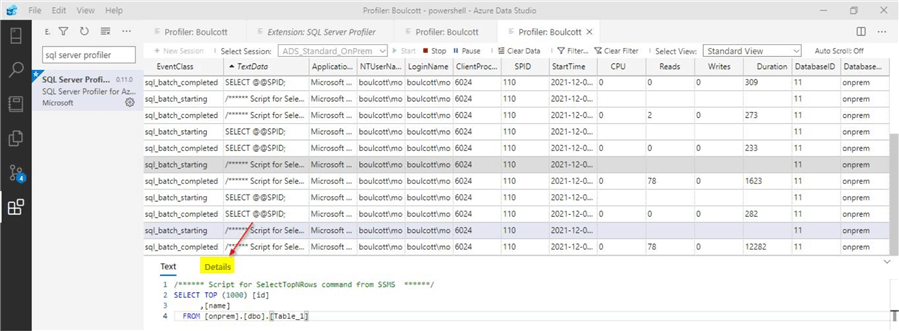
You can see the actual code that was running against the database. I had applied the filter clause in this case. If you click on the 'Details' option, you will be able to see more useful information which will help you to analyze further.
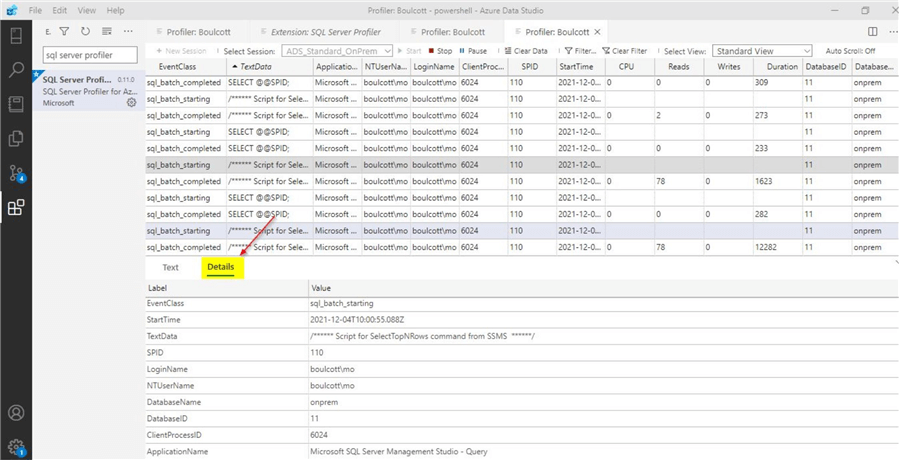
Likewise, you will be able to review the other data collected based on the activity information that is collected.
Can we use this feature on an Azure SQL Database?
So far, the demo was performed using an on-premises SQL Server. The next obvious question is whether this extension can be used to run a profiler trace session on an Azure SQL Database. The answer is 'Yes'. Make sure that you select the correct Azure SQL Database when you provide the Azure server details in the 'Connection' option as shown. You will get this 'Connection' option after you click on 'Launch Profiler' in the 'Command Palette' which was shown in the earlier sections.
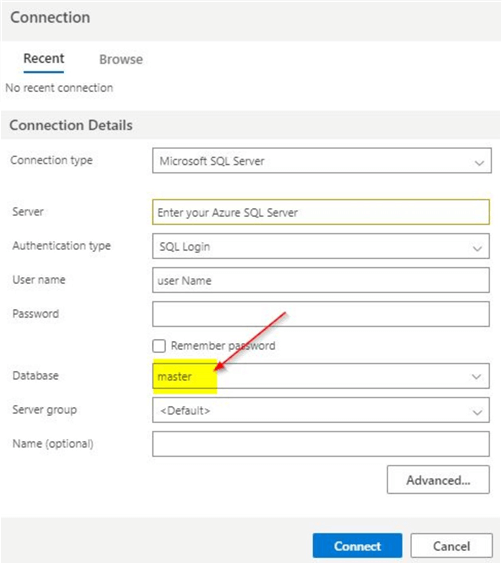
By default, 'master' database option is available. Make sure that you change it to the correct Azure SQL Database. If you select the 'master' database option for your Azure server and try to launch the profiler, you will get this error message.
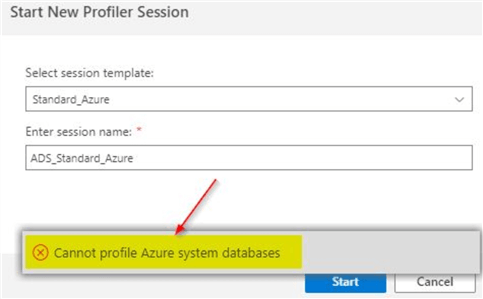
However, when you select the correct Azure SQL database and launch the profiler, you will get to view this template specifically for Azure.
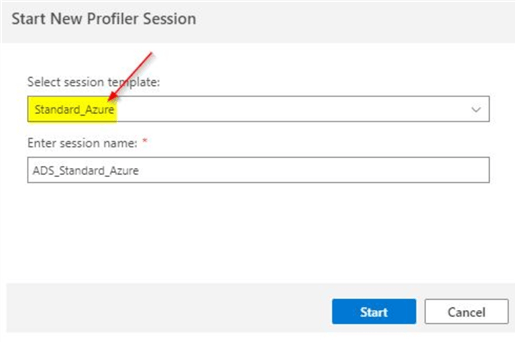
You can click on the 'Start' option which will start the profiler on the Azure SQL Database. The interface will be similar to what was performed while using the profiler on an on-premises server as shown below.
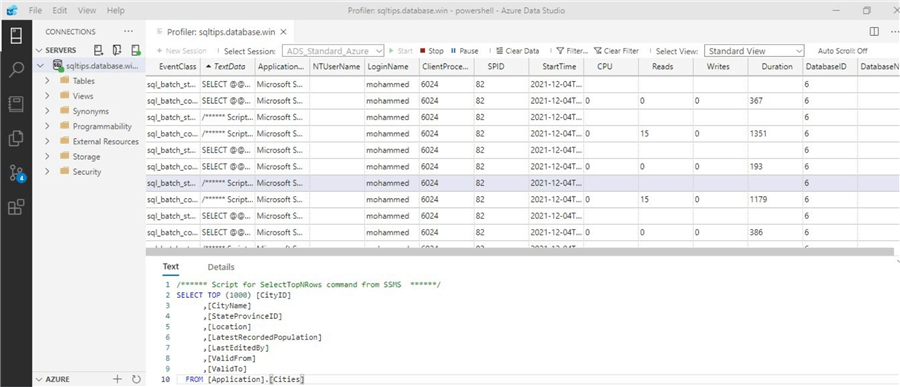
The features are the same, but this is running on an Azure SQL Database. As you can see in this demo, you saw how we could make use of Azure Data Studio to run the profiler tool. As mentioned earlier, the name profiler is misleading in this case, as this Azure Data Studio extension is built using extended events unlike the profiler that is available in SSMS. The process to run the profiler is quite simple and can be started in a few easy clicks.
Next Steps
- You can try out Azure Data Studio that is already available in SSMS. If not, you can download Azure Data Studio separately from this link.
- Download the required profiler extension described in this tip
- Review this tip and try out the demo on your lab server to launch the profiler
About the author
 Mohammed Moinudheen is a SQL Server DBA with over 6 years experience managing production databases for a few Fortune 500 companies.
This author pledges the content of this article is based on professional experience and not AI generated.
View all my tips
Article Last Updated: 2021-12-22


