Problem
We’ve seen how to export result sets from SSMS to Excel in this article Export Data from SSMS to Excel, but if you use Azure Data Studio (ADS) there are several more options to export data, including an easier option to export data to Excel.
Solution
ADS allows exporting directly to:
- Comma Separated Value (CSV)
- Microsoft Excel
In addition, ADS also supports directly exporting to these formats that are not supported in SSMS:
- JavaScript Object Notation (JSON)
- Extensible Markup Language (XML)
- Chart
- Visualizer – with SandDance Extension for Azure Data Studio installed
- Jupyter Notebook
We’ll run a simple query and walk through examples of how to export results from ADS to each of the above formats.
Sample Dataset to Export
Note: This tip was written with ADS version 1.38.0, which is the latest as of this writing.
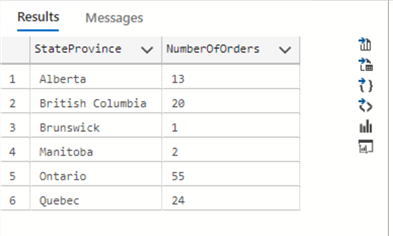
The goal of this tip is simply to demonstrate exporting from ADS, so we’ll keep the query and result set very simple. It will give us the number of orders in the AdventureWorksLT2019 database by Canadian province.
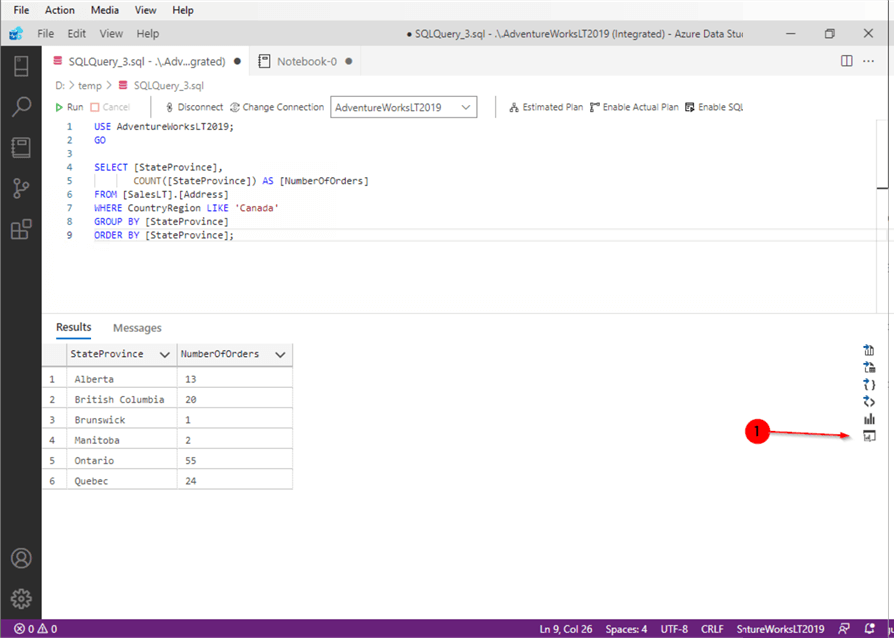
-- use AdventureWorksLT2019
USE AdventureWorksLT2019;
GO
-- get number of orders by Canadian province
SELECT [StateProvince], COUNT([StateProvince]) AS [NumberOfOrders]
FROM [SalesLT].[Address]
WHERE [CountryRegion] LIKE 'Canada'
GROUP BY [StateProvince]
ORDER BY [StateProvince];
And here is the result set.
Save As CSV from Azure Data Studio
It’s possible we need to import the result elsewhere and simply want to export to a delimited file. So first we’ll see, just like in SSSM, we can export the results directly to a .csv file.
- Click the ‘Save As CSV’ icon
- Choose folder to save file to
- Name file
- Save

A new tab is automatically opened and displays our comma separated values.

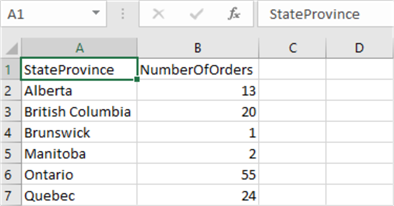
Save as Excel from Azure Data Studio
This is where we’ll start to see the advantages of using ADS. Now, we’ll directly export the result set to an Excel file. We’ve seen that it’s easy to do in SSMS, but it takes more than one step. ADS makes it simpler by letting us do it in just one step. All we need to do is:
- Click the ‘Save As Excel’ icon
- Choose folder to save file to
- Name file
- Save

Opening the file in Excel shows our result set.
Save As JSON from Azure Data Studio
Another scenario is you may need to export a result set to a JSON file for transfer. ADS allows a direct export here as well. The pattern is the same.
- Click the ‘Save As JSON’ button
- Choose folder to save file to
- Name file
- Save

A new tab is automatically opened, and the JSON formatted file appears in it.

Save As XML from Azure Data Studio
Yet another scenario is you want to transfer data in an XML file. Same process, different icon.
- Click the ‘Save As XML’ button
- Choose folder to save file to
- Name file
- Save

As with the JSON file, a new tab is opened, and the XML file is opened in it.

Alternate Save As Method from Azure Data Studio
As with most anything, there is more than one way to accomplish the same thing. Alternatively, to save as CSV, Excel, JSON, or XML you can do the following.
- Right click in the result set, choose your file format, and follow the steps above

Create Charts from Azure Data Studio
You may need a graphical representation of the data instead of a text file. ADS gives us the functionality to export directly to a chart. It’s as easy as:
- Click the ‘Chart’ button

And the chart is displayed in the Results pane. For this example, I’ve chosen a Bar chart, checked off ‘Use first column as row label’, and ‘Legend Position’ on the left and here is what is produced.

From here we have the options of copying the image to the clipboard or saving it as a Portable Network Graphics (.png) file.

And here is a copy of the chart pasted from the clipboard.

Using Data Visualizer from Azure Data Studio
One powerful feature of ADS is the ability to add extensions. Extensions are a quick and easy way to add additional functionality to ADS.
The SandDance Extension for Azure Data Studio provides a quick way to create visualizations of for your data. Installing SandDance adds an additional icon.
- Click ‘Visualizer’ icon
Here I’ve chosen a Scatter Chart to show the visualized data.

Export as Jupyter Notebook from Azure Data Studio
You can also export the result set to an interactive Jupyter Notebook.
- Click ‘Export as Notebook’

The Jupyter Notebook opens in a new tab.

From here, the Notebook can be edited, and queries executed from within it.
- Click Run all to run query

From here you can edit the notebook in ADS.

Next Steps
- We’ve seen how to export results to Excel, CSV, JSON, XML, charts, visualizations with an ADS extension, and Jupyter Notebooks. This is just a small piece of ADS functionality.
- Here is a link to more SQL Server Azure Data Studio Tips.

Joe Gavin is from Greater Boston and has worked in technology as a Field Service Engineer for an automotive dealer computer system vendor, a Technical Consultant and Operations Analyst with Sybase and SQL Server based database applications in financial services and now works as a SQL Server Database Administrator.
- MSSQLTips Awards:
- Achiever Award (75+ Tips) – 2024 | Author of the Year – 2021 | Author Contender – 2024 |
- Rookie Contender – 2018