By: Aaron Bertrand | Updated: 2022-03-07 | Comments | Related: 1 | 2 | 3 | 4 | 5 | > TSQL
Problem
Without comprehensive reporting tools (or Excel), it can be cumbersome and frustrating to produce perfect report output from SQL Server SELECT statement or stored procedures. In modern versions, we have access to T-SQL functionality that far exceeds old-school ROLLUP and CUBE, like PIVOT, UNPIVOT, and GROUPING SETS. Let's look at how to produce output we can easily plug into a simple front end and produce great-looking reports.
Solution
Say you store information about your data centers and servers, and have a central table that stores exceptions from every server (for brevity I’m not going to enforce relationships here, be fussy about naming constraints or supporting Unicode, or include other columns you would likely have):
-- We name data centers after planets / moons from Star Wars:
CREATE TABLE dbo.DataCenters
(
    DataCenterID int PRIMARY KEY,
    Name         varchar(32) NOT NULL UNIQUE
);

INSERT dbo.DataCenters(DataCenterID, Name) VALUES
    (1,'Tatooine'), (2,'Endor');


-- And servers are named after characters:
CREATE TABLE dbo.Servers
(
    ServerID     int IDENTITY(1,1) PRIMARY KEY,
    Name         varchar(16) NOT NULL UNIQUE,
    DataCenterID int NOT NULL
);

INSERT dbo.Servers(Name, DataCenterID) VALUES
    ('R2-D2',1), ('C3-P0',1), ('BB-8',1), ('K2-SO',1),
    ('Luke',2),  ('Leia',2),  ('Han',2),  ('Chewie',2);


-- Exceptions are stored here:
CREATE TABLE dbo.ServerExceptions
(
    EventTimeUTC datetime2(3) NOT NULL DEFAULT sysutcdatetime(),
    ServerID     int NOT NULL,
    ErrorDetails varchar(256) NULL,
    INDEX CIX_ServerExceptions CLUSTERED(EventTimeUTC, ServerID)
);
And let’s say you want a report that shows how many exceptions came from each server in 2021. My favorite part of these examples is coming up with a query that will generate a bunch of relevant, random data in one go:
;WITH n(n) AS
(
   SELECT TOP (1000) ROW_NUMBER() OVER (ORDER BY @@SPID)
   FROM sys.all_columns
),
s AS
(
   SELECT ServerID, DataCenterID,
      NumRows = ABS(CHECKSUM(NEWID())) % 1000,
      MinuteDiff = ABS(CHECKSUM(NEWID())) % 1000 FROM dbo.Servers
)
INSERT dbo.ServerExceptions(EventTimeUTC, ServerID)
   SELECT DATEADD(MINUTE, n.n * MinuteDiff, '20210101'), ServerID
   FROM s
   INNER JOIN n ON n.n >= s.NumRows
   WHERE DATEADD(MINUTE, n.n * MinuteDiff, '20210101') < '20220101';
As an interesting side note, if you look closely, you’ll see how I weighted exceptions toward the beginning of the year, implying that you got better at preventing or resolving exceptions as the year went along.
With data in place, let’s say you want to produce a report that looks like this, with totals within data centers and overall rolled upward, and no data center names repeated:
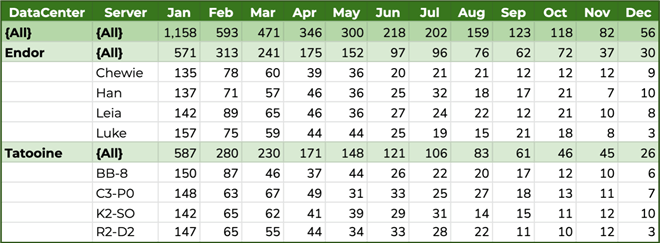
I will walk through how you can progress from a simple aggregate query to a PIVOT query that returns this identical output (colors and styling aside, which are still the responsibility of the front end anyway):
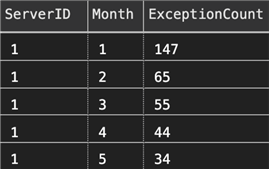
You can start with a simple aggregate function SQL query:
SELECT ServerID,
    [Month] = DATEPART(MONTH, EventTimeUTC),
    ExceptionCount = COUNT(*)
FROM dbo.ServerExceptions
WHERE EventTimeUTC >= '20210101'
  AND EventTimeUTC <  '20220101'
GROUP BY ServerID, DATEPART(MONTH, EventTimeUTC)
ORDER BY ServerID, [Month];
Partial results:
Next, you’ll want to introduce GROUPING SETS, because these will allow you to produce header/totals rows. To simplify repeated expressions, tuck the aggregate query inside a CTE or derived table with this syntax:
;WITH src AS
(
    SELECT ServerID,
           [Month] = DATEPART(MONTH, EventTimeUTC),
            ExceptionCount = COUNT(*)
    FROM dbo.ServerExceptions
    WHERE EventTimeUTC >= '20210101'
      AND EventTimeUTC <  '20220101'
    GROUP BY ServerID, DATEPART(MONTH, EventTimeUTC)
)
SELECT ServerID,
       [Month],
        ExceptionCount = SUM(ExceptionCount)
 FROM src
 GROUP BY GROUPING SETS((ServerID, [Month]), ([Month]))
 ORDER BY ServerID, [Month];
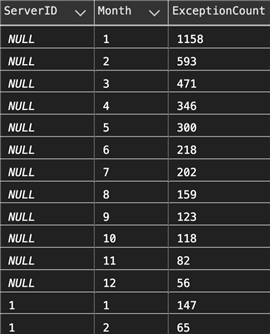
This produces an additional 12 rows of output; one for each month and for each server, so the ServerID is NULL. Partial results:
Next, you can add the Server and DataCenter names to the output, by nesting an additional CTE that pulls in the names from the related tables, and adding DataCenter to the beginning of each grouping set with this SQL statement:
;WITH src AS
(
    SELECT ServerID,
           [Month] = DATEPART(MONTH, EventTimeUTC),
           ExceptionCount = COUNT(*)
    FROM dbo.ServerExceptions
    WHERE EventTimeUTC >= '20210101'
      AND EventTimeUTC <  '20220101'
    GROUP BY ServerID, DATEPART(MONTH, EventTimeUTC)
),
srv AS
(
    SELECT DataCenter = dc.Name,
           [Server]   = s.Name,
           src.[Month],
           src.ExceptionCount
    FROM src
    INNER JOIN dbo.Servers AS s
            ON src.ServerID = s.ServerID
    INNER JOIN dbo.DataCenters AS dc
            ON s.DataCenterID = dc.DataCenterID
)
SELECT DataCenter         = COALESCE(DataCenter, '{All}'),
       [Server]           = COALESCE([Server],   '{All}'),
       IsDataCenterHeader = GROUPING(DataCenter),
       IsServerHeader     = GROUPING([Server]),
       [Month],
       ExceptionCount     = SUM(ExceptionCount)
 FROM srv
 GROUP BY GROUPING SETS
 (
    (DataCenter, [Server], [Month]),
    (DataCenter, [Month]),
    ([Month])
 )
 ORDER BY DataCenter, [Server], [Month];
Note too how you use the GROUPING function to determine if the row is indeed a “header” row that sums all its children. Partial output:
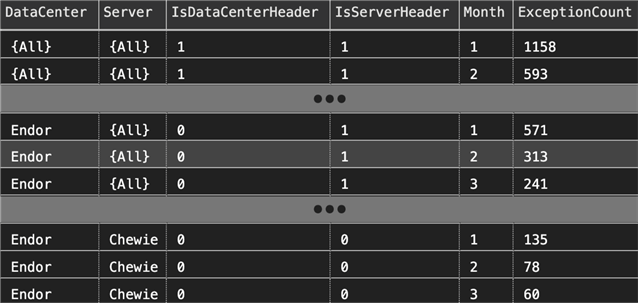
Next, you can apply a PIVOT to this output, after adding yet another CTE (you could do this without CTEs, but it’s much easier to step through and investigate intermediate resultsets):
;WITH src AS
(
    SELECT ServerID,
           [Month] = DATEPART(MONTH, EventTimeUTC),
           ExceptionCount = COUNT(*)
    FROM dbo.ServerExceptions
    WHERE EventTimeUTC >= '20210101'
      AND EventTimeUTC <  '20220101'
    GROUP BY ServerID, DATEPART(MONTH, EventTimeUTC)
),
srv AS
(
    SELECT DataCenter = dc.Name,
           [Server]   = s.Name,
           src.[Month],
           src.ExceptionCount
    FROM src
    INNER JOIN dbo.Servers AS s
            ON src.ServerID = s.ServerID
    INNER JOIN dbo.DataCenters AS dc
            ON s.DataCenterID = dc.DataCenterID
),
agg AS
(
    SELECT DataCenterName    = COALESCE(DataCenter, '{All}'),
           [Server]           = COALESCE([Server],   '{All}'),
           IsDataCenterHeader = GROUPING(DataCenter),
           IsServerHeader     = GROUPING([Server]),
           [Month],
           ExceptionCount     = SUM(ExceptionCount)
    FROM srv
    GROUP BY GROUPING SETS
    (
       (DataCenter, [Server], [Month]),
       (DataCenter, [Month]),
       ([Month])
    )
)
SELECT * FROM agg
PIVOT
(
    MAX(ExceptionCount) FOR [Month] IN
    (
       [1],[2],[3],[4], [5], [6],
       [7],[8],[9],[10],[11],[12]
    )
) AS p
ORDER BY IsDataCenterHeader DESC,
         DataCenterName,
         IsServerHeader DESC,
         [Server];
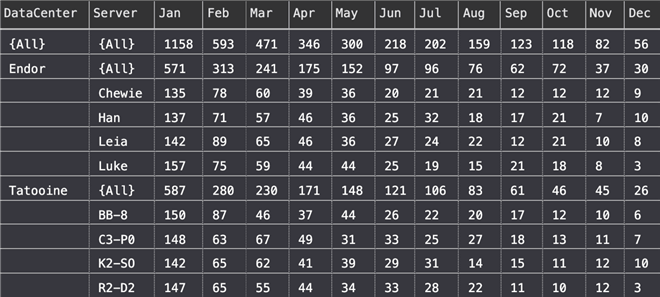
This will produce output like the following:
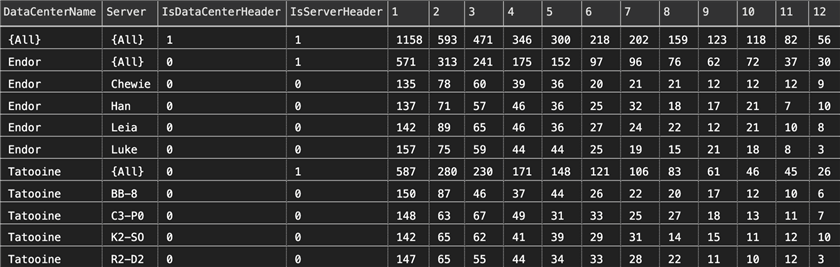
However, the use of SELECT * prevents the output from matching our ideal output (but I always start that way with PIVOT as I build out the query). We need to set some of the DataCenterName values to empty strings, remove the IsHeader columns, and convert the month number headers to month name abbreviations.
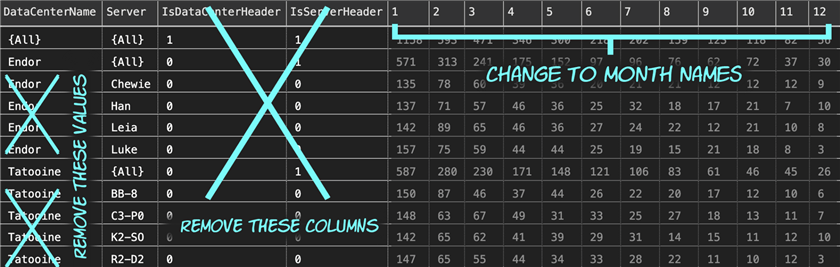
To fix these items, you can just make a few adjustments to the final SELECT query:
…
SELECT DataCenter = CASE WHEN IsDataCenterHeader + IsServerHeader > 0
                         THEN DataCenterName ELSE '' END,
       [Server],
       Jan = [1], Feb = [2],  Mar = [3],  Apr   = [4],
       May = [5], Jun = [6],  Jul = [7],  Aug   = [8],
       Sep = [9], Oct = [10], Nov = [11], [Dec] = [12]
FROM agg
PIVOT
(
   MAX(ExceptionCount) FOR [Month] IN
   (
      [1],[2],[3],[4], [5], [6],
      [7],[8],[9],[10],[11],[12])
) AS p
ORDER BY IsDataCenterHeader DESC,
         DataCenterName,
         IsServerHeader DESC,
         [Server];
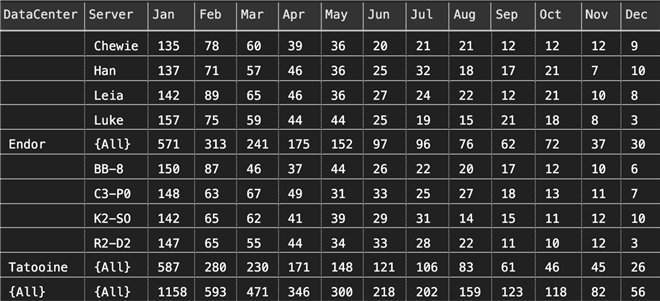
Now you’re looking good:
You could of course order the result differently, if you want the totals to push down, just change the final ORDER BY to remove the DESCs:
…
ORDER BY IsDataCenterHeader,
         DataCenterName,
         IsServerHeader,
         [Server];
Now the result will look like this:
Conclusion
Both SQL Server PIVOT and GROUPING SETS provide tremendous flexibility over the shape of your output, and can really reduce the amount of heavy lifting that has be done by your presentation layer or middle tier. Sure, Excel is great at crosstab and conditional formatting, but that only scales to individual report consumers. Sometimes you need the database to drive as much of the report’s shape as possible.
Next Steps
See these tips and other resources:
- Learning the SQL GROUP BY Clause
- Group By in SQL Server with CUBE, ROLLUP and GROUPING SETS Examples
- Crosstab queries using PIVOT in SQL Server
- Script to create dynamic PIVOT queries in SQL Server
- GROUP BY GROUPING SETS and the GROUPING function in the Microsoft documentation


About the author
 Aaron Bertrand (@AaronBertrand) is a passionate technologist with industry experience dating back to Classic ASP and SQL Server 6.5. He is editor-in-chief of the performance-related blog, SQLPerformance.com, and also blogs at sqlblog.org.
This author pledges the content of this article is based on professional experience and not AI generated.
View all my tips
Article Last Updated: 2022-03-07
