Problem
Implementing a relational database schema can be difficult, especially when a proper model is needed that helps map out the relationship between the various attributes in the schema. In this tutorial, we take a look at the various aspects of building a data model which is a component of software engineering.
Solution
Entity Relationship Modelling is a graphical approach to database design. It employs Entity Relationship Diagrams (ERD), a flowchart that illustrates database tables, attributes, primary keys, foreign keys and how they interact with one another in business processes—making it easier for you to implement your schema. ER diagrams are essential as they represent data in a diagram manner. This makes it easier for non-technical business owners to have a unified view of data, relationships, functionality and business processes.
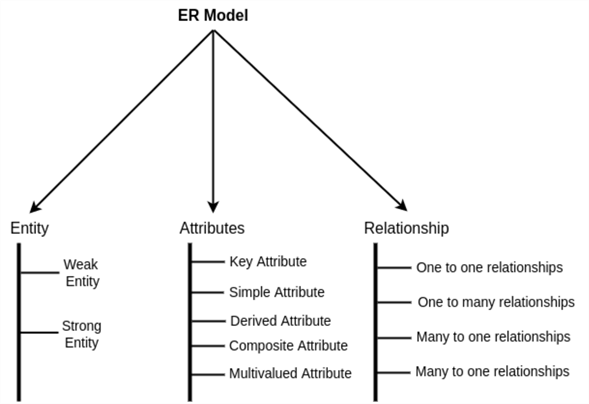
Components of ERD Diagram
ER diagrams are composed of three elements: entities, attributes, and relationships.
Entities
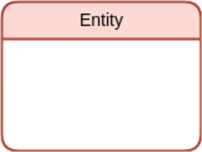
An entity is an object or concept (noun) that stores data in a database. In ER diagrams, entities are represented using a rectangle. The image below depicts an entity represented in an ER diagram:
A collection of entities with similar attributes are referred to as entity types and can either be a weak entity type or a strong entity type.
Weak Entities
A weak entity type is an entity that depends on another entity in an ER diagram. It can be identified uniquely using the primary key of another entity. For that, weak entity sets need to have other entities.
Note: A weak entity does not have a key attribute.

In the diagram, the Purchase Order, a weak entity, cannot exist without the other entity, Purchase. This shows how weak entities are used in any ER Diagram. They are represented with a double rectangle and are dependent on strong entity types (denoted with a single rectangle), as seen in the image above.
Strong Entities
A strong entity type is an entity with its primary key making them independent of any other entity. They are represented with a single rectangle in ER diagrams.
The table below shows the key differences between strong and weak entity types.
| Strong Entities | Weak Entities |
|---|---|
| They have a primary key. | They lack a primary key. |
| They are represented with a rectangle. | They are represented with a double rectangle. |
| They are not dependent on other entities. | They are dependent on strong entities. |
| In an ER diagram, the relationship between two strong entity sets is shown by using a diamond shape. | The relationship between one strong and a weak entity set is shown in an ER diagram using the double diamond shape. |
| Strong entities have either total participation or no participation. | Weak entities always have total participation. |
Attributes
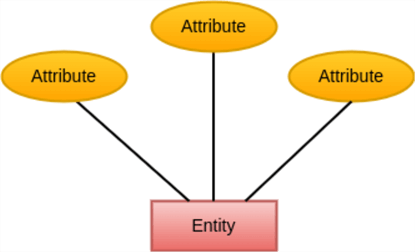
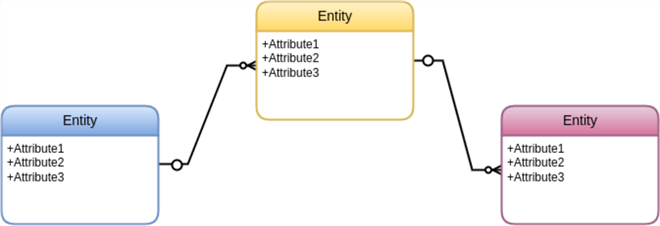
Attributes are properties that define an entity or a relationship. In ER diagrams, attributes are represented using a circle or an oval. The image below depicts an entity with three attributes represented in an ER diagram:
There are five types of attributes: key attributes, simple attributes, composite attributes, derived attributes, and multi-valued attributes.
- Key Attributes: This attribute uniquely identifies each entity in the entity set. For example, a Student_ID can be the key attribute of the entity ‘Student’ because two students cannot have the same student id. In ER diagrams, the key attribute is represented by an oval with underlying lines. For example:

- Simple Attributes: These attributes cannot be subdivided into components—for example, a student's age. Simple attributes are depicted in ER diagrams with a simple oval shape without any lines. For example:

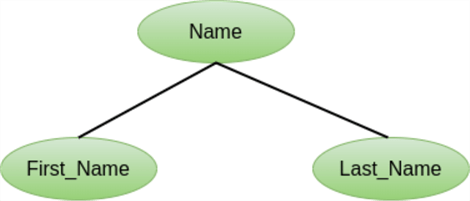
- Composite Attributes: These are attributes that can be divided into components. For example, a student’s full name can be divided into a first and last name, as shown in the image below:
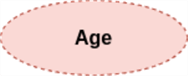
- Derived Attributes: These are attributes derived from existing attributes. For example, a student's age can be derived from a student's date of birth and the current year. Derived attributes are depicted with an oval drawn with broken lines, as shown in the image below.
- Multi-valued Attributes: These are attributes that can have more than one value. An example could be a student’s phone number, as a student can have more than one. Multi-valued attributes are represented with a double oval diagram. For example:

Relationships
A relationship refers to how two or more entities interact with each other. They are displayed as diamond labels placed on the lines connecting the entities. In ER diagrams, relationships are represented by diamond shapes.
For example, the image below shows a “buy” relationship between a Customer entity and a Product entity.

Cardinality
Cardinality refers to the maximum number of times a relationship between instances of an entity and a different entity can occur. It defines how many instances of an entity are related to instances of another entity.
There are different types of cardinal relationships, which include:
- One-to-One Relationship
- One-to-Many Relationship
- Many-to-One Relationship
- Many-to-Many Relationship
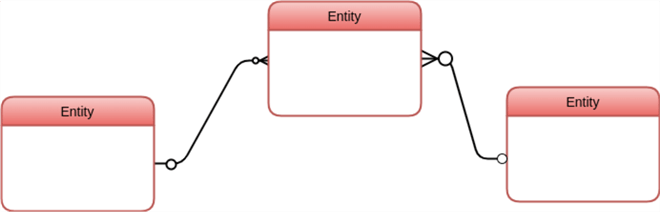
The image below describes how each cardinal relationship is represented in an ER diagram.
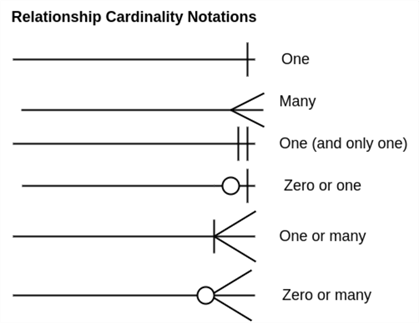
In the image above, the single circle ○ at the opposite end of the relationship indicates a minimum cardinality of zero and a maximum of 1, meaning an optional or partial relationship.
The one single bar | at the opposite end indicates “exactly one,” so the relationship is mandatory or total.
Then, the Crow’s foot notation (three-pronged symbol) indicate that multiple rows are affected by the relationship.
One-to-One Relationship
A one-to-one relationship is one in which an instance of entity A can be associated with only an instance of entity B and vice versa.
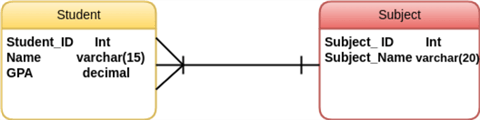
For example, the image below depicts a one-to-one relationship between a Teacher entity and a Subject entity, i.e., a teacher can only be associated with one subject.
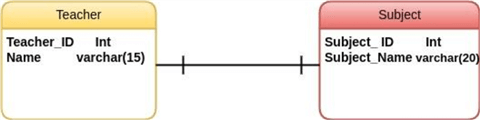
The One-to-One relationship is depicted in an ER diagram with a single line connecting the two entities. In our diagram above, the line connects the Teacher entity to the Subject entity. The two perpendicular lines (|) indicate an important relationship between the two entities. In other words, the teacher can teach only one subject, and a subject has only one teacher.
One-to-Many Relationship
A one-to-many relationship is a relationship whereby a single instance from entity A can be associated with multiple instances of entity B. Still, an entity from entity set B can be associated with at least one entity.
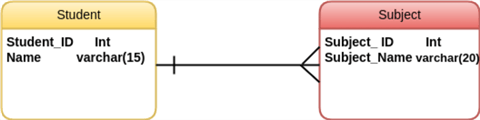
The ER diagram above depicts one-to-many cardinality with a line joining the two entities. The connectors reflect the different characteristics of this relationship. The single vertical line (on the left side of the line) indicates that this connector only has one row affected by the relationship. The crow’s foot (on the right side of the line) indicates that the connector has many rows influenced by the relationship.
Many-to-One Relationship
A many-to-one relationship is a relationship whereby an instance from entity B can be associated with multiple instances of entity A. However, an entity from entity B may or may not be associated with more than one entity from entity set A. For example, the image below represents a relationship whereby many students can take the same class:
Many-to-Many Relationship
A many-to-many relationship is a relationship between two entities in an ER Diagram. For example, the relationship between entity A and entity B where entity A is linked with many instances of entity B or vice versa.
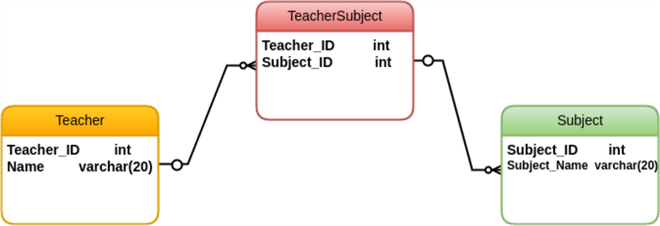
From the example above, the TeacherSubject, TeacherID refers to the ID attribute in Teacher, and the Subject ID attribute in TeacherSubject refers to the ID in the subject entity.
Database Modeling
A data model is a visual representation of how data are connected, processed, and stored inside the system. Data models describe how the structure of a database is modeled. While all three levels of a data model contain entities, attributes, and relationships, they differ in the purposes they are created for and the audiences they are meant to target.
Conceptual and logical data models are adopted by business analysts to model business objects in an existing system, while database professionals adopt conceptual and logical ER models to produce the physical model that presents the physical database structure ready for database creation.
Conceptual Data Model
A Conceptual Data model is an organized way of representing database concepts and their relationship. The purpose of having a conceptual data model is to define which entities exist and the attributes and their relationships. It is developed to present an overall picture of the system by recognizing the business objects involved.
Logical Data Model
The logical data model is a detailed version of the conceptual data model. The logical data model specifies each entity's column, which is the entity's attribute.
Physical Data Model
The physical data model represents an actual database-specific implementation of the data model. It elaborates on the logical data model by assigning each column with the data type, length, nullable, etc. It helps generate the schema and offers database abstraction.
Note: Ensure the column types are supported by the Database Management System and reserved words are not used in naming entities and columns.
Below is an example of a physical data model:

How to Draw an ER Diagram
This article will use the following data requirement sheet for a school, which we will be modeled into an ER diagram.
Data Requirements
A student has a unique student id, a name, grade point average (GPA), honors, and a club membership. A student can be assigned multiple subjects. A teacher can only take one subject each. A teacher has a teacher id and subject id.
Step 1: Determining Database Requirements
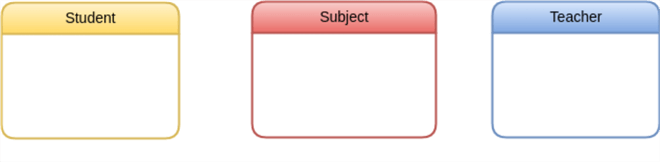
First, you must identify the entities in the data requirement sheet. The requirement sheet above has three entities: Student, Subject, and Teacher.
The image below represents how each entity is shown in an ER Diagram.
Step 2: Adding Attributes
Next, you must identify each entity's attributes to map them to the correct entity.
The table below shows the entity, primary key, and attributes of the data requirement sheet.
| Entities | Primary Key | Attributes |
|---|---|---|
| Student | Student_ID | Name, GPA, Honors, Club |
| Subject | Subject_ID | Subject_Name |
| Teacher | Teacher_ID | Subject_ID |
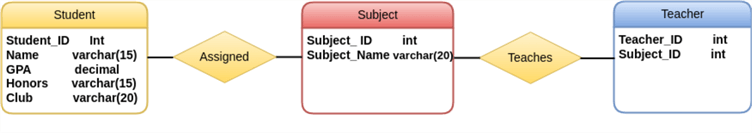
The image below shows the attributes of each entity and its types.

Step 3: Defining Relationship Between Entities
Next, you need to identify the relationship between each entity to understand the cardinality between the entities.
The data requirement sheet has the following relationships:
- A student can be assigned multiple subjects
- A teacher can only teach one subject
Step 4: Adding Cardinality
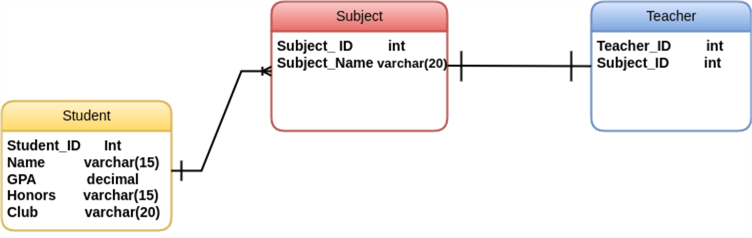
Finally, you must find the relationship between each entity to draw a complete ER Diagram.
In the data requirement sheet, the relationship between the student and subject entities is one-to-many, as the student can take as many subjects as he wants. In contrast, the relationship between the subject and the teacher is one-to-one, as a teacher can only take one class, as shown in the image below.
ER Diagram Tools
They are several free and commercial tools for drawing ER Diagrams online. Some of these are:
- draw.io (free | online)
- Dia (free | desktop)
- ERDPlus (free | online)
- SmartDraw (commercial | online)
- Creately (freemium | desktop)
- Ludichart (freemium, commercial | online)
Conclusion
This article covered most of the essential components of an ER diagram, including entities, attributes, relationships, and cardinality, which are core parts of drawing ER Diagrams.
Entities, attributes, and relationships are essential to any ER diagram. ER diagrams are easy to understand and do not require a technical professional to understand. ER diagrams can be easily translatable into relational tables, which can be used to build databases quickly.
Next Steps
- Check out these related articles about SQL Server Database Design

David Ekete is a software developer and technical writer with experience building scalable backend infrastructure for web applications and writing various in-depth articles related to backend-focused software development and database administration.


Found this ERD guide super helpful! Always struggled to visualize table relationships clearly before. The breakdown of weak vs. strong entities and the different attribute types finally made it click. Definitely gonna try sketching out my next project’s schema using an online Mermaid viewer to practice these concepts. Diagrams make everything so much easier to understand!
This tutorial is super helpful for beginners like me! I’ve been struggling with database design, and the breakdown of strong vs. weak entities made it click. Also, I recently tried a mermaid diagramming tool for ERDs, and it’s a game-changer—super intuitive compared to manual drawings. Anyone else using mermaid for this?
You can also try Luna Modeler to create conceptual, logical, and physical data models and ER diagrams. For details, visit https://www.datensen.com
Very informative!
All the database modeling tools you mentioned have limitations on their free plans. Take a look at https://www.erdlab.io which is a free ERD tool with more features than any of the ones you mentioned in the article.
Import/Export SQL and supports MySQL, PostgreSQL, Oracle, MS SQL, SnowFlake and more.
You can try it out without registering directly at https://app.erdlab.io
It is interesting to see a differentiation between a conceptual, a logical and a physical data model. For the latter, I use MS Visio.
very good article with lots of useful information