Problem
Microsoft Power BI Desktop provides different ways to help shape data. One of the options is formatting text columns. We often need to clean our text columns because they contain text randomly. In such cases, data cleansing includes removing unnecessary spaces in data, capitalizing necessary words in the text field, and so on. This tip will highlight some available ways to format text columns in Power BI.
Solution
Whether it is the past or present, an ever-increasing portion of human history, interaction with each other and environment, culture, likes and dislikes, have been penned down and recorded in the form of ‘text.’ Only recently, however, some of these ancient texts have been transformed and digitized to become text data. As the variety, volume, and velocity of big data continues to expand and become readily adopted so is the need to store and process this data. This has given birth to a data-centric strategy across various organizations where statistics and insights from the data are given more weight than experience and intuition for decision-making. However, we should not forget the notion of garbage in, garbage out, which means that if your data is unreliable, your data-based decision is unreliable. Here, this reliability is pointing towards the completeness and cleanness of data. This tip will overview the cleaning and manipulation of text data using Microsoft’s Power BI.
Text cleaning refers to the process of transforming certain parts of a text so that it becomes more understandable and cleaner before the analysis stage. A subset of this process is text formatting, whereby we are interested in modifying the appearance, structure, or style of text data to meet specific requirements or standards.
Suppose your company wants to host a dinner for its managers on its 10th business anniversary. As a result, a form is distributed among the employees confirming their availability and any possible food allergies. Unfortunately, since we forgot to set up data validation in our form, we can expect the following results:

Considering the state of the data in the above illustration, it is as useful to us as a broken pencil. Sure, it conveys information, but it does so in a haphazard manner. For instance, the names of people are not standardized in terms of formatting. Some names are all in uppercase, some in lowercase, and some with trailing and leading whitespaces. The same is the case with other columns. Hypothetically, if we were to print these names as it is on the event guest sheet, surely it would be unprofessional and reflect poorly on the business.
Therefore, we see that data formatting is an essential step for several important reasons:
- Data Consistency: When data is aggregated from multiple sources or is collected over a long period of time, inconsistencies in the formatting of text data are expected. Formatting standardization ensures that data can be merged and analyzed effectively.
- Ease of Analysis: Well-formatted data is easier to work with. Provided the name column above was properly formatted, your company’s HR department could effortlessly send a personalized email invite to the attendees without worrying about the text format.
- Data interpretation: Provided that your text data is in a uniform format, it will be much more understandable to both technical and non-technical users. It enhances the ability to interpret data correctly, especially in data visualizations. If your data is formatted strangely, as in the example above, your manager’s attention is likely to divert to that rather than the insight that is being communicated by a visual.
- Usability: Well-structured and formatted data can be processed in a more meaningful way by certain algorithms. Text formatting and cleaning is a major step in Natural Language Processing (NLP) as it removes the noise from the data and ensures that it is ready for modeling. There is a big difference between the sentiments in the sentence ‘Please be quiet‘ and ‘PLEASE. BE. QUIET.‘
Creating a Schema in SQL Server
Now that we understand the fundamental concept behind text formatting and scenarios where we might use the technique, it is time for a more practical demonstration.
We will create a schema in SQL Server representing the top 15 employees with the highest sales figures. This data is hypothetically aggregated from different firms spread out throughout the country, which means that text formatting issues are to be expected.
To get started, we will first create our database in SQL Server and then access it using the following command:
--MSSQLTips.com
CREATE DATABASE format_text;
USE format_text;
Now, we can create our table to store the relevant data related to the above scenario.
--MSSQLTips.com
CREATE TABLE top_employees
(
employee_id INT,
employee_name VARCHAR(255),
sales INT,
branch VARCHAR(255)
 );
We can now insert erratic text values in our data that we will format later. The idea is that since the employee data is being collected from separate companies, it was stored in different formats, or in most cases, no standardization effort was implemented before.
--MSSQLTips.com
INSERT INTO top_employees VALUES
(23, 'Aly John', 50000, 'arizona'),
(90, 'charlotte miller   ', 34000, 'colorado'),
(21, '    mia MARTINEZ ', 67000, 'tennessee'),
(59, 'Noah davis   ', 55000, 'tennessee'),
(92, '  ava jones  ', 89000, 'arizona'),
(18, 'SOPHIA JAMES', 37000, 'washington'),
(42, '     aiden Taylor', 40000, 'tennessee'),
(83, 'lIAM BrowN  ', 73000, 'arizona'),
(77, '  Will jackSON ', 36000, 'washington'),
(30, 'Chuck James   ', 45000, 'tennessee'),
(82, 'Saul Morison ', 63000, 'colorado'),
(95, '   Isabella moore ', 77000, 'washington'),
(12, ' aleya ANDERSON ', 51000, 'tennessee'),
(78, ' KANUTE David ', 84000, 'colorado'),
(27, '  KholE jAmes   ', 31000, 'arizona');
After executing the above command, we can view our table using the SELECT command, as shown below:
--MSSQLTips.com
SELECT * FROM format_text.dbo.top_employees;

Text Formatting Using Power BI
Now that we have created our data model using SQL Server, it is time to export it to Power BI desktop to deal with the numerous text formatting issues using the format functionality in Power Query Editor.
Step 1: Importing Data to Power BI
We will first need to import our data from SQL Server to get started. To do so, in the main interface of Power BI, click on the “SQL Server” icon in the “Data” section of the “Home” ribbon, as shown below.

The “SQL Server database” dialogue box will open. Enter your relevant server and database credentials in the input fields below and click “OK.”

The image below shows the “Navigator” window, which will appear when Power BI successfully connects with your database. Below the “Display Options” button, select the table in your database.
As we can see, Power BI also gives the option to preview our dataset at this stage. We can instantaneously observe the inconsistencies in our data. To fix this problem, click the “Transform Data” button at the bottom right.

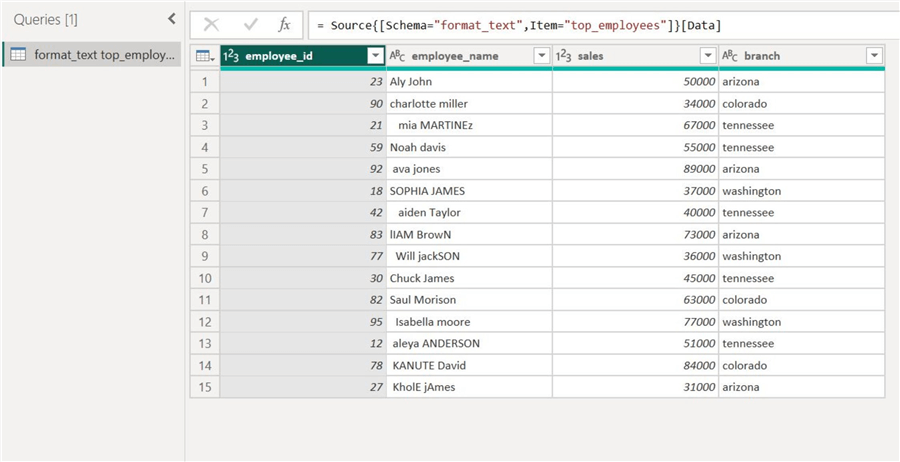
This will cause the Power Query Editor to open, and now we can observe our dataset in its main window, as shown below.

Step 2: Formatting Using Add Prefix
The first column we will format is the “employee_id” column, as shown. So, what’s the problem with it? Identification figures are typically not stored in an integer-type column. This is because if the ID contains any leading zeros, those leading zeros will disappear if that data is cast to an integer type. Although for a real number, ‘0023’ does indeed equal ’23’, this is not true with IDs. So essentially, our column “employee_id” is not encoding the correct information. This will also disturb the relation of this column to a dimension table of all employees.
So, our hypothetical firm’s ID naming convention is to assign ’00’ as the first two digits of the employee_id.
To do this, click “Transform” and select the “Format” option in the “Column” section. This will produce a drop-down list where we can select the “Add Prefix” option.

The “Prefix” dialogue box will open. In the “Value” field, enter ’00’ and click “OK” at the bottom.

As we can see below, our “employee_id” column is now correctly encoding the information. It has been appended with ’00’ in the beginning using Power Query Editor’s Format functionality.

Step 3: Formatting Using Trim, Lowercase, and Capitalize
Now, we will bring our attention to the “employee_name” column. There is a lot that is wrong here. There are leading and trailing spaces, all upper-case letters being used, and names are not appropriately capitalized.

A lot is going on! We will be standardizing this column step by step.
First, we will remove the unnecessary whitespaces in the names. We can again go to the “Format” option and select the “Trim” button as shown.

We can observe the changes below.

Secondly, since our column has a chaotic mixture of upper- and lower-case characters, we can start by making every observation lowercase. To do so, click the “lowercase” option in the “Format” list below.

Now, all our names have been converted to their lowercase equivalents.
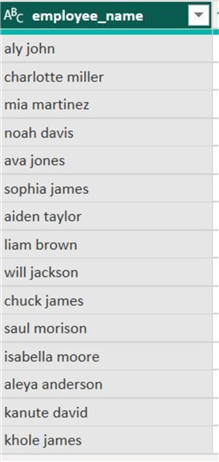
As for our last step, we need to capitalize the first letter of each word in this column. Click “Capitalize Each Word” under the “Format” option.

Our column is now free of trailing and leading spaces, and each word is capitalized correctly.

Step 4: Formatting Using Add Suffix
Although our “branch” column is not as erratic as the previous columns, we need to format it by appending the country name at the end of the state name. Provided there is no country column in this table, it will be a good practice to append it in the “branch” column, especially if our hypothetical firm is a multi-national corporation. If similar datasets are to be merged, then the country suffix will help distinguish the branch country for each observation.

Click “Add Suffix” under the “Format” section below.

The “Suffix” dialogue box will open, and for this particular table, we have added ‘US’ as the value to be appended at the end of each observation since all of the states are American.

We can observe the appended value below.

Step 5: Saving and Exiting Power Query Editor
The finalized version of our dataset is shown below. In this step, we explored the flexibility of the “Format” option in Power Query Editor for standardizing the formatting of your text-based data. It now looks cleaner and much more interpretable.

After manipulating our data, we can exit the Power Query Editor by clicking “File” and “Close & Apply.”

Step 6: Building a Visual
We will now be directed to the main interface of Power BI. To explore the usability of our cleaned dataset, we will create a horizontal bar chart to visualize the stats of the top company employees.
Click the “Clustered bar chart” icon in the “Visualizations” panel below.

To populate the chart, drag the “sales” column from the “Data” section to the input field of the “X-axis” as shown below. Similarly, drag the “employee_names” column to the “Y-axis” input field.

We can now observe our horizontal bar chart, which is sorted by default.

Conduct Analysis
In this tip, we have discussed the basics of text formatting and why we might need this technique as a part of our data manipulation process. It is time to analyze our visuals to gain insights. As we can see below, Mrs. Jones amassed the highest sales figures, peaking at 89000 units. Other employees below this number closely follow, and there is no significant disparity among the top 15 employees. Since our visual is sorted, we can easily infer that Mrs. James had the lowest stats out of these 15 employees, with her sales figure around 30 units. We have leveraged the formatting text column option available in Power BI to have this clean visual with beautiful insights.

Next Steps
- To further explore this topic, readers are encouraged to look at another text formatting option in the Power Query Editor’s “Add Column” section. This option has the same functionality as the Format option discussed in this tip. Instead of modifying the original column, the “Add Column” generates a new column with the formatted results.
- Furthermore, one can work with options like ‘clean’ and ‘uppercase’ under the formatting option. Although the use of ‘uppercase’ formatting is self-explanatory, ‘clean’ removes all unprintable characters from your text data.
- For more complicated formatting techniques, look at the FORMAT() function using DAX. It is a very flexible function that allows you to manipulate a range of data types apart from just strings. You can format a string number to include currency symbols, comma-separated digits, and convert them to scientific notation. It can also edit data/time formats and certain numeric format characters. When this function is coupled with other DAX commands like IF, it is also possible to implement conditional formatting.
- To explore other formatting tips in Power BI

Harris Amjad currently works as a Software Engineer at Strategic Systems International. He is Microsoft Certified Data Analyst and Microsoft Certified Trainer. A rigorous, task-driven Data Enthusiast with substantial experience in Data Science, Data Analysis, and Data Engineering.
- MSSQLTips Awards: Trendsetter (25+ tips) – 2024 | Author Contender – 2023, 2024 | Rookie Contender – 2022


Was exactly what I was looking for. Thanks.