Problem
Since we have experienced a number of unplanned outages and failovers on our SQL Server Always On Availability Groups, we want to know the root cause to prevent them from happening in the future. How do we identify the root causes of unplanned Availability Group outages and failovers?
Solution
In a previous tip, Collect Logs for Analyzing Unplanned Availability Group Outages and Failovers using SQL LogScout, we collected the logs necessary to start analyzing unplanned Availability Groups outages and failovers. And while you can manually go through each log to decipher error messages and analyze potential root causes of the issues, there is an easier way to do so. The Microsoft technical support engineers created a tool called AGDiag that does exactly this. AGDiag is mentioned in this Microsoft documentation as the preferred tool for analyzing failover and failures of SQL Server Always On Availability Groups. You use SQL LogScout to collect the logs and analyze them using AGDiag.
Download and Install AGDiag
To get started, download AGDiag from its GitHub repository. AGDiag is a Windows client app written in C# that can be used to analyze logs collected using SQL LogScout, PSSDiag, and TSS SQL Base Diagnostics Collector. It analyses and compares the collected logs to create a summarized report of the potential root cause of an Availability Group outage or failover. Unlike SQL LogScout, which contains a compilation of PowerShell, batch files, and T-SQL scripts, AGDiag is a compiled EXE that includes the required DLLs to run properly.
Extract the compressed file to any location on your workstation. SQL Server installed on the machine is not required to run AGDiag. A Windows 11 workstation can even work well as long as SQL Server Management Objects (SMO) is installed. If you have SQL Server Management Studio installed on your workstation, you’re good to go. We will be using C:\AGDiag as the location for this tip.
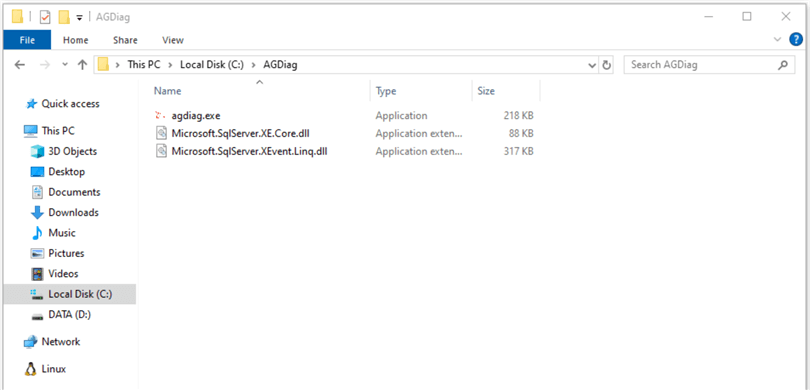
Three files will be included in the compressed file: the EXE file (agdiag.exe) and two DLL files for reading Extended Events.
Note: Before running AGDiag, copy the output folder generated by SQL LogScout to your workstation and paste it into C:\AGDiag.
Using AGDiag to Parse the Collected Logs
Run the agdiag.exe file to open AGDiag. You’ll see a simple app that briefly describes what it does and how to use it. It’s very straightforward.

To start parsing the logs, click Select Log Folder, navigate to the location of the output folder, and click OK.

When you point AGDiag to the location of the output folder, it starts parsing the logs and generating a report. This can take a while, depending on the amount of logs collected. Be patient. Once completed, it will open the HTML report file using your default browser. The HTML file will be saved in the same folder as AGDiag with the filename AGDiagReport.htm.
Reviewing the Generated Report
The report begins with a summary section, the server name, and a list of all the parsed logs—Windows Server Failover Cluster logs, SQL Server error logs, AlwaysOn_health Extended Events sessions, SQL Server system health Extended Events sessions, and anything that shows potential root causes. Imagine having to perform the time-consuming task of manually parsing through the different log sources. AGDiag makes that process as easy as clicking a button.
Notice the black expand triangle in each section. Clicking this will expand the report to show more details. For example, it shows all the SQL Server error logs parsed to create the report. This gives you an idea of which logs to look into for further analysis. You can click on the triangles for each section to see the contents of the corresponding logs used to generate the report.

Next, look at the AVAILABILITY GROUP HEALTH EVENT SUMMARY REPORT section. This contains a high-level summary of the different events that caused issues to the Availability Group. Each Event ID corresponds to an event that occurred and a link to the section about that event. Note: The date and time of the events correspond to local server time. Date and time arithmetic may be necessary if the server is in a different time zone than the workstation running AGDiag. The Event ID acts as a link and will direct you to the corresponding section that provides additional details about the event.
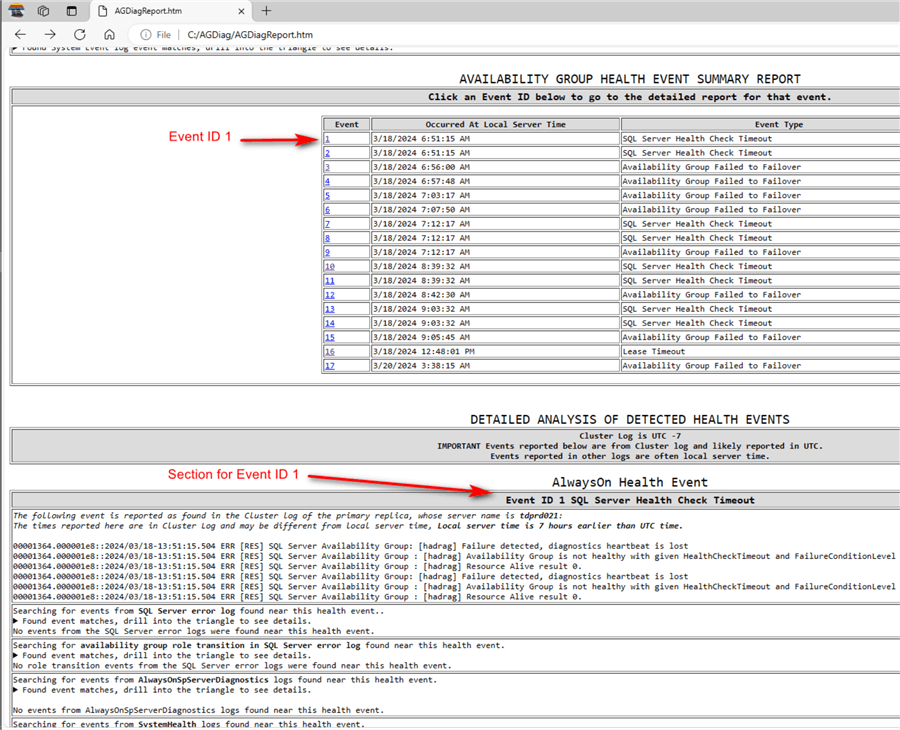
Let’s look at the first entry: Event ID 1.
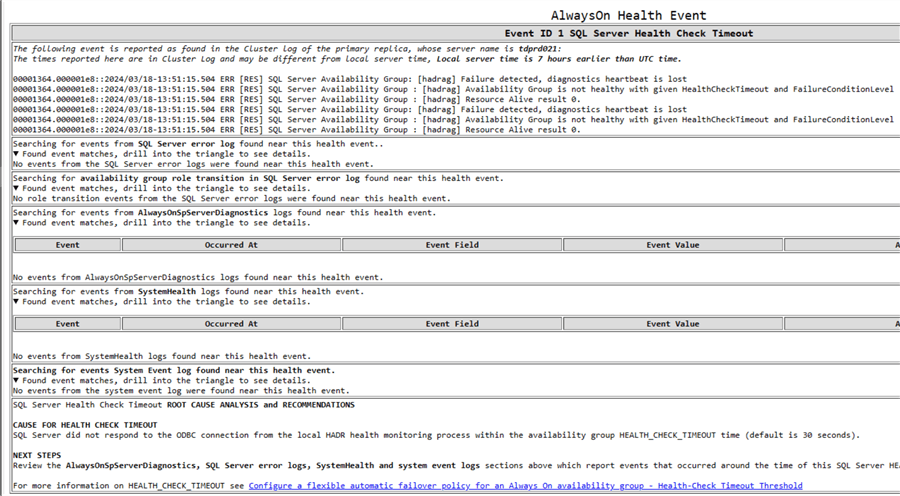
The Windows Server Failover Cluster log reports a “Failure detected, diagnostics heartbeat is lost” followed by an “Availability Group is not healthy with given HealthCheckTimeout and FailureConditionLevel.“
The ROOT CAUSE ANALYSIS and RECOMMENDATIONS section tells me that the Availability Group was offline during this time and was caused by exceeding the HEALTH_CHECK_TIMEOUT value. While it may be tempting to simply increase the HEALTH_CHECK_TIMEOUT value from the default 30 to mitigate the issue, this may only be a symptom and not the real root cause. Perform additional investigation and analysis. Look at your monitoring tool. Ask your server or VM admins. The good thing about this is you’re narrowing down your investigation to a specific date and time and a specific cause (HealthCheckTimeout exceeded).
NOTE: I’ll say it again because it is worth repeating. Do not simply change the default values like HEALTH_CHECK_TIMEOUT, FAILURE_CONDITION_LEVEL, or SESSION_TIMEOUT on the Availability Group, or the heartbeat settings on the failover cluster. While you may have stopped the unexpected outages or failovers, it’s just a temporary fix. Find the real root cause and fix that instead. I couldn’t count the number of cases I’ve worked on where changing the default values only masked the real root cause and caused more problems outside of SQL Server. In fact, Availability Group outages have led me to uncover hardware and infrastructure problems that could have caused more catastrophic incidents.
Going through the different events sequentially can give you some ideas of what caused the Availability Group outage.
Let’s look at another example: Event ID 16.

The Windows Server Failover Cluster log reports a “Lease timeout detected…” followed by a sequence of log entries containing performance counter data. The ROOT CAUSE ANALYSIS and RECOMMENDATIONS section tells me that the Availability Group was offline during this time, which was caused by exceeding the lease timeout value. A lease timeout event can be caused by a generated SQL Server stack dump large enough to exceed the timeout value or a system-wide performance issue.
The ROOT CAUSE ANALYSIS and RECOMMENDATIONS section tells me that there are no SQL Server Dump diagnostics around the time of the lease timeout event. So, that rules out a potential SQL Server issue. However, it tells me that the “Average disk sec/write appears to be high and could have contributed to lease timeout event.” A snippet of the Windows Server Failover Cluster log also shows a pattern of increasing CPU utilization. Again, while it may be tempting to simply increase the lease timeout value from the default 20 to mitigate the issue, this may only be a symptom and not the real root cause. Perform additional investigation and analysis. Look at your monitoring tool. Ask your server or VM admins. Collect additional performance data if you do not already have it. You want to know your performance baseline to make the proper decision. It could be that the server capacity is no longer sufficient to handle the workload and may need additional compute and/or storage resources.
You’ve seen how you can use AGDiag to easily parse through the collected logs and analyze root causes of unplanned Availability Groups outages. What could take hours can now be done with a click of a button with AGDiag.
Next Steps
- Read more about AGDiag from the GitHub repository
- Download and install AGDiag
- Start parsing and analyzing logs using AGDiag with SQL LogScout to identify the root causes of unplanned Availability Groups outages and failovers
- Read Microsoft documentation on Troubleshooting and diagnostic tools for SQL Server on-premises and hybrid scenarios

Edwin M. Sarmiento is the Managing Director of 15C, a consulting and training company that specializes on designing, implementing and supporting SQL Server infrastructures. He is a Microsoft SQL Server MVP and Microsoft Certified Master from Ottawa, Canada specializing in high availability, disaster recovery and system infrastructures running on the Microsoft server technology stack ranging from Active Directory to SharePoint and anything in between. He is very passionate about technology but has interests in music, professional and organizational development, and leadership and management matters when not working with databases. Edwin lives up to his primary mission statement: “To help people and organizations grow and develop their full potential.”
- MSSQLTips Awards: Champion Award (100+ tips) – 2017 | Author of the Year Contender – 2020, 2017

where can i find a working agdiag.exe?
The instructions to launch [agdiag.exe] no longer work with the most recently available version of this file.