Problem
What are some ways data professionals can think about, check on, and test data quality?
Solution
Data quality continues to be a top priority for any data organization. This is measured by conditions defined by your organization including:
- The data needs
- The priority of the data
- The processes needed to obtain the data
Data in Your Organization
The perception of data within your organization plays a significant role in how data quality is measured. If data is considered “golden” or is portrayed as the “new oil,” the organization relies heavily on data and quality is a prominent characteristic. In this situation, robust testing infrastructure needs to be in place to test, alert, and monitor the values assigned to the quality measures. A quality measure is a value that provides the level of quality pertaining to a specific data set or even overall for the entire data warehouse at a quick glance.
If data plays a lesser role in the organization, it does not mean that there should be any less of an infrastructure for testing data quality. But it means that the dependency on such data may not be as instrumental in the daily operations of that organization. It is likely that the organization still needs monitoring in place.
As you can see, quality and testing are likely important to every organization and require them to consider their data quality measures.
Testing Data Quality
As established in the previous section, the need to test your data is pretty much a given. When considering a testing process, it is important to establish some baseline definitions and tools for usage throughout this process. Fundamentally, data quality is testing assumptions and testing assertions. Although they may appear the same, their definition and implementation are impactful to the testing process. So, let us start with definitions.
Assertions
- Data assertions delineate what is held true about the data. This term’s utilization is like an offshoot of the term from the auditing field.
- Generally, the data owners, or maybe the data analysts, will have notated statements of “fact” about the data.
- An example of a data assertion would be that the invoice table only contains non-deleted invoices.
- Data could and often should have tests in place to assess for adherence to these assertions.
- These tests provide assurance that the data used matches the assertions.
- Data auditors often love these types of tests as they want assurance that what the organization says about the data matches what the data portrays.
- Assertions often act as a checkbox or checkpoint or gate for the data.
Assumptions
- Data assumptions are thoughts or traits about data that are taken for granted.
- Generally, assumptions have no specific proof.
- They can impact how the data is sourced, stored, queried, analyzed, and ultimately reported on.
- Assumptions can be statistically related (formally) such as data are normally distributed or contain certain variability or represent a population.
- Assumptions can also be non-statistics related (casually) such as “this data is bad,” all the data is from 2025, or a particular field in a table represents one specific thing.
Of course, these variations in language mean data analysts, data engineers, DBAs, and data scientists must utilize tools to complete testing. Testing is a broad category of topics but can include local unit testing, CICD level testing, and ultimately, data quality testing. Our focus here is how to test our data quality once an ingestion is enabled and data is flowing. This also includes pre- and post-ingestion monitoring and methods of communicating, such results to data producers, data engineers, and data consumers.
Detail Test Ideas
Jumping into the actual testing process, Python provides several out-of-the-box tools or easy-to-add packages to help solve data quality validation and testing methods that are easy to implement and scale. Could similar testing be completed in SQL? Likely yes, but it may not scale across different data sources and may take procedural methods needed to scale across data volumes and more like systems.
So how can we start our testing? The examples below start the process of various statistical and non-statistical testing surrounding the SuperStore sales dataset in the form of a CSV file; this data can be sourced from Kaggle, Tableau, or even several other dataset sharing sites.
In the examples below, Python 3.12 on an Anaconda instance of Juniper notebooks is used. However, other versions of Python and IDEs can be used with the proper installation of any of the used packages.
To help with navigation through the dataset, Pandas is the one package used throughout to provide significant enhancements for navigation via a data frame. These tips can help you with setting up and using Pandas:
- Read SQL Server Data into a Dataframe using Python and Pandas
- Combine Data in Python using Pandas Merge, Pandas Join and Pandasql
Testing for Missing or NULL Values
The first test is to check for missing or null values. If values are missing in a dataset, it can be an indicator of bad data at the source or even problems with downstream transformation or join logic.
import pandas as pd
import numpy as np

# Load dataset
file_path = 'C:/Users/rsmur/Downloads/superstore.csv'
df = pd.read_csv(file_path)

# Check for missing values
missing_values = df.isnull().sum()
print('Null or Blank Values')
print(missing_values) 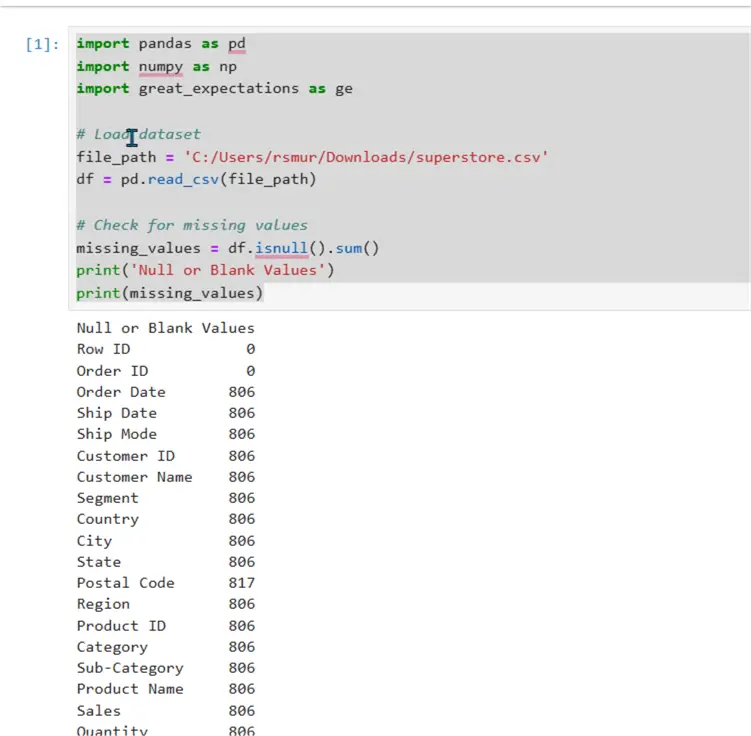
Running this code, we can quickly see that the Row ID and Order ID seem to all have non-blank and non-null values. However, the remaining fields seem to have an issue with missing values. It is also apparent, due to the same value (806) repeating for all the fields, that the missing values are consistent across many of the same rows.
Testing for Duplicate Rows
The next test that can be implemented looks for duplicate rows. Just as missing data and field values are important, duplicate rows can again indicate a problem with data sourcing or join conditions. Likewise, such repeated rows can indicate situations where the granularity of the data has not been properly sourced.
import pandas as pd
import numpy as np

# Load dataset
file_path = 'C:/Users/rsmur/Downloads/superstore.csv'
df = pd.read_csv(file_path)

# Check for duplicate rows
dup_rows = df[df.duplicated()]
print('Duplicate Rows')
print(dup_rows)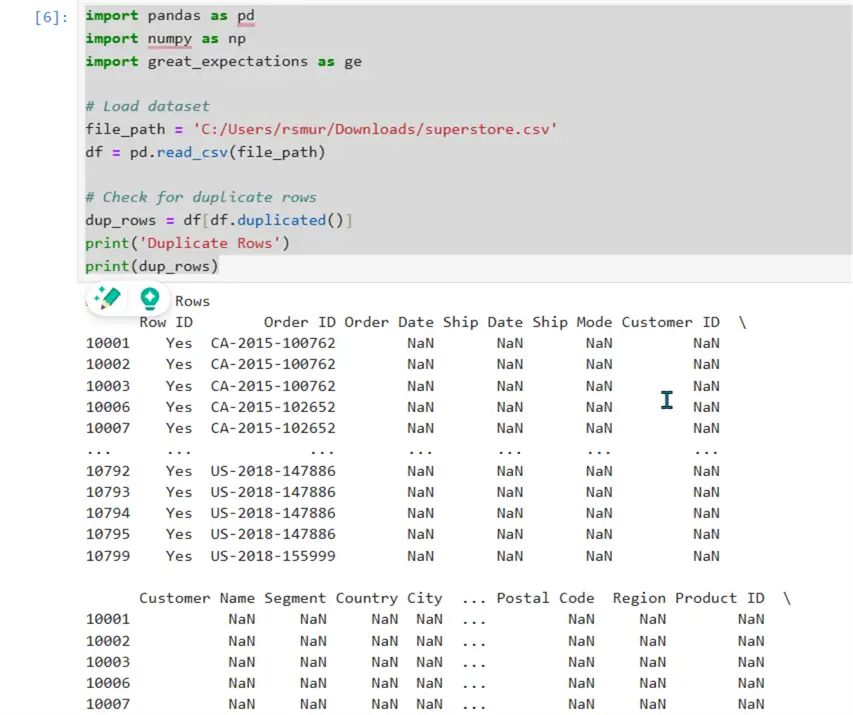
In the SuperStore sample dataset, several rows are duplicated (shown above), and these rows may be the same rows with missing values, as indicated by the NaN.
Statistical Quality of the Data
While the first two tests were based on basic assertions about the data, the next item can focus on the statistical quality of the data. In this particular set of tests, we explore using statistic-based Z-Scores to identify outliers in the data. Z-Scores measure the distance from the mean for a value in a dataset.
import pandas as pd
import numpy as np
import great_expectations as ge
from scipy import stats

# Load dataset
file_path = 'C:/Users/rsmur/Downloads/superstore.csv'
df = pd.read_csv(file_path)

# Check for outliers via Z-scores
df['sales_zscore'] = np.abs(stats.zscore(df['Sales'], nan_policy='omit'))
df['profit_zscore'] = np.abs(stats.zscore(df['Profit'], nan_policy='omit'))
threshold = 3
outliers = df[(df['sales_zscore'] > threshold) | (df['profit_zscore'] > threshold)]
outliers = outliers[['Row ID','Sales','sales_zscore','Profit','profit_zscore']]
print('Outlier Values greater than 3 Zs')
print(outliers) 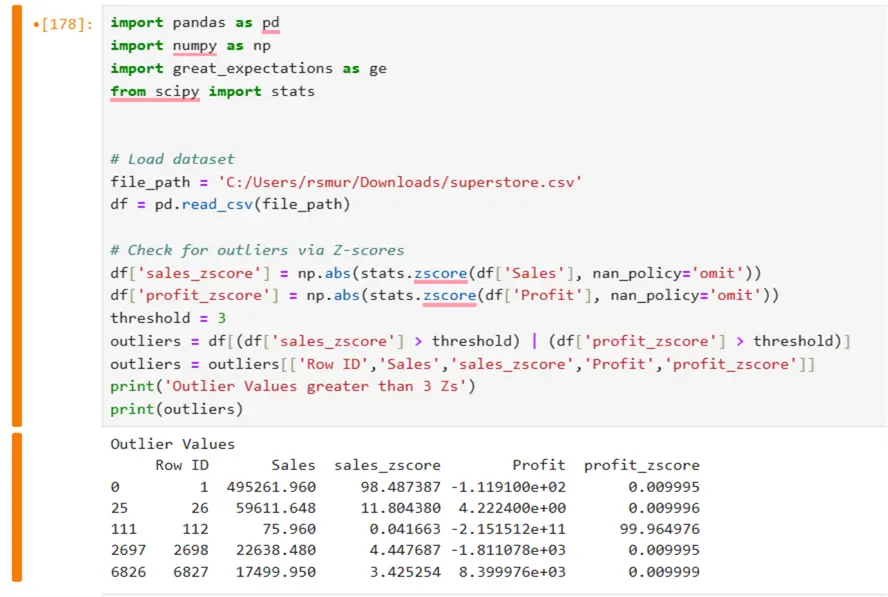
The above test and results definitely take a deeper dive into the data through the utilization of additional packages and related imports for the statistical work. For this example, the Z-Score is measured for both the sales and profit fields, then the Z-Scores of only those greater than 3 are returned. The score of 3 is an indicator of a significant diversion from the mean.
Final Set of Tests
The final set of tests uses the great expectations package to run several more advanced tests. In executing these tests, the Pandas data frame needs to be converted into a great expectations data source, dataset, and batch. This package contains several preset “expectations,” or pre-defined tests that can be executed against a dataset.
import pandas as pd
import numpy as np
import great_expectations as ge

# print(ge.__version__)
# Get the Ephemeral Data Context
context = ge.get_context()
assert type(context).__name__ == "EphemeralDataContext"

# Load dataset
file_path = 'C:/Users/rsmur/Downloads/superstore.csv'
df = pd.read_csv(file_path)
# display(df)

data_source = context.data_sources.add_pandas("superstore_sales")
data_asset = data_source.add_dataframe_asset(name="superstore_sales_asset")

batch_definition = data_asset.add_batch_definition_whole_dataframe("batch definition")
batch = batch_definition.get_batch(batch_parameters={"dataframe": df})
#
# # Other Checks
expectation_range = ge.expectations.ExpectColumnValuesToBeBetween(column="Profit", min_value=2, max_value=10000)
validation_result = batch.validate(expectation_range)
print(validation_result)

expectation_notnull = ge.expectations.ExpectColumnValuesToNotBeNull(column="Profit")
validation_result_notnull = batch.validate(expectation_notnull)
print(validation_result_notnull)
The above tests are significantly more complicated than the basic tests used to this point, but they also cover several reviews all at once.
The first test reviews the noted column, Profit, and evaluates it against a range of values for the profit column. It lists the values that do not fall within the noted range, and as such, provides a decent profile of the data. It also should be noted that this test provides significantly more details than the prior test.

The second test evaluates a column to determine if it should be NULL. This test’s results, shown below, exemplify the level of detail for this test. Not only do we see the count of those with null values, but this test provides the percentage null, along with the listing of null values. (This is helpful in instances where we need to see the rows.)

Next Steps
- In this tip, the testing of data was discussed in the framework of data quality. Data quality covers a host of different areas, but specifics on data quality testing were discussed. From there, we completed a deep dive to discover the differences between assumptions and assertions about data. Finally, several examples of data quality testing using Python were reviewed.
- Check out these additional resources:

I have a passion for crafting Business Intelligence Solutions for my user groups. My experience includes almost 15 years of SQL Server involvement with the last 12 years focused specifically on Business Intelligence, SharePoint, OLAP, SSRS, and Decision Support solutions. Currently, I am a Business Intelligence Architect in the healthcare industry, and I also teach database and analytics classes for Kennesaw State University, Southern New Hampshire University, and Reinhardt University. My education includes an MBA and an undergraduate in Accounting (yes I am a reformed accountant!), both from Kennesaw State University. I enjoy every day by trying to grow my faith and spend precious time with my family. I have been happily married to my wife of over 20 years, and we have two teenagers one who we home school with the help of a University Model School, Cornerstone Prep in Acworth, GA (cornerstoneprep.org). Our other child is a Construction Management major at KSU’s Southern Poly / Marietta campus. We are a soccer and Cross Country (XC) family who play, coach, and referee soccer or run for fun most every day. For several years, our family has volunteered (and played with the dogs and cats) at Etowah Valley Humane Society in Cartersville, GA.
- MSSQLTips Awards: Champion (100+tips) – 2016 | Author of the Year – 2015 | Author Contender – 2014, 2016-2021