Problem
In most modern businesses, by default, operational systems are managed in a way that only shows the current view of things in their data like active tickets, open incidents, active complaints, and daily sales. While this is a great way to monitor day-to-day reporting, it however tends to hide an important narrative for the business. For instance, it does not show how things have changed over time. It also does not tell a story on how previous periods compared to the current, in terms of the actual state of the data.
So, without a snapshot view implementation, there is no way to accurately view when data changes, and this may lead to a loss of the previous view forever with no way to retrieve that snapshot.
Solution
Snapshot views is a technique used in data warehousing to track changes in data over time. This is done by extracting and saving periodic copies or snapshots of the datasets.
In this tip we will be looking at an example of a company that tracks IT and Support incidents in a database and then create a Power BI report from the dataset. With this example, each day, an upload of Incident Status data is completed with each upload overwrites the previous uploads. This results in only seeing the latest statuses in the database table.
Sample Data
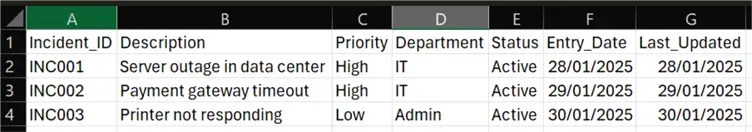
Let’s look at a three-day upload of this incident status data into the table as seen in the three files below:
Day 1 Data:
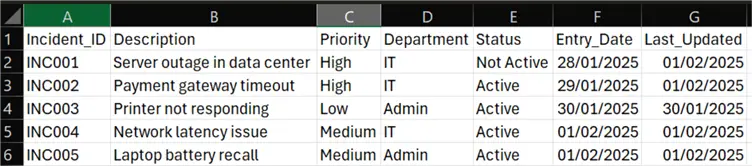
Data for Day 2:
Day 3 Data:
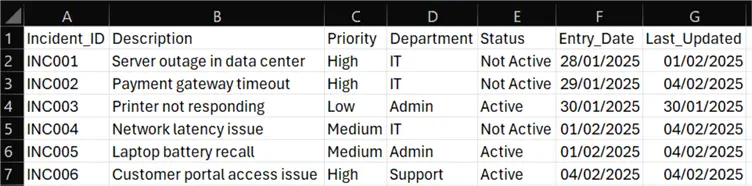
The above datasets are a snapshot of each day’s incident status data. However, without implementing snapshot logic, you would end up with only Day 3’s view of your data with no way of recalling what the previous day’s view looked like. This is usually the case when you tend to overwrite the data in a table.
Snapshot Views in Microsoft Fabric Dataflow Gen 2
I will demonstrate how we can achieve snapshot views of this dataset using Microsoft Fabric Dataflow Gen 2.
Prerequisites for implementation
- You should have a Microsoft Fabric license or free license to implement this
- You should have a Microsoft Fabric Workspace created, if one does not exist
- You should create a Lakehouse in the Workspace
Implement Snapshot data views using MS Fabric Dataflows Gen 2
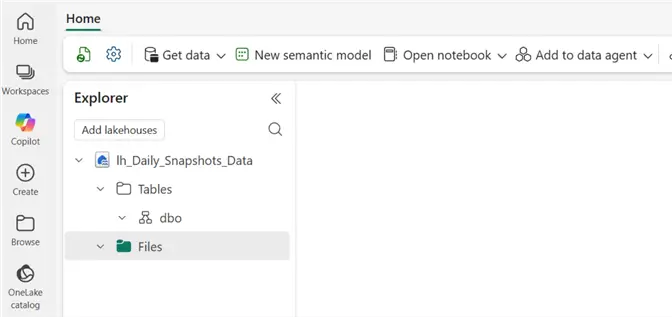
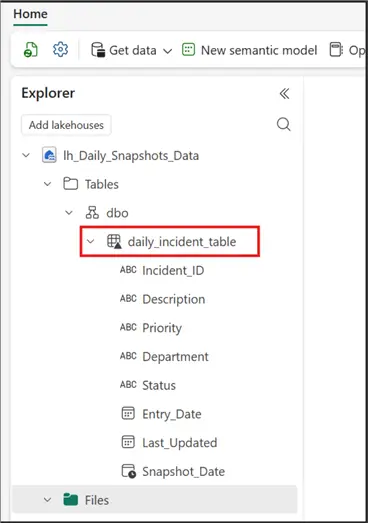
In this demo, I have created a Workspace in Microsoft Fabric called “PBI_Daily_Snapshots”, and on it I have created a Lakehouse named “lh_Daily_Snapshots_Data” as seen in the image below.

I will next get the incident data for Day 1 into my Lakehouse via a Dataflow Gen 2 connector. To do this, I will need to click on the Lakehouse I just created and have it opened as seen in the image below.
Within the Lakehouse I will click on “Get data” and then select “New Dataflow Gen2” as seen in the image below.

Next, you will need to give the Dataflow a name, I have named mine “df_get_incidents_data” as seen in the image below. Then click “Create”

Get Data
While within the Dataflow Gen 2, you need to click on “Get data” and select your source connector. For this demo I will be selecting “Text/CSV” as seen in the image below.

The uploaded file is as seen in the image below.

Apply Key Logic
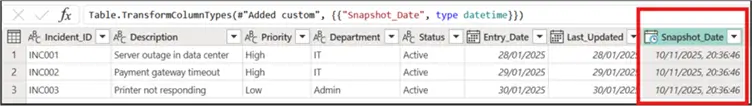
After uploading the file, you will need to apply the key logic here next. You need to add a Custom column for a datetimestamp. This datetimestamp column is what will help you automate the periodic snapshots of your data. To do this, you will simply need to click on “Add column”, then “Custom column” and then enter the M-Query code as seen in the image below. Once done, click OK.

Once done, you should now be able to see a new datetime column added to your table in Dataflow Gen 2 as seen in the image below. Remember to change the datatype of the new “Snapshot_Date” column to datetime.
Next, you will need to do any transformations you want to apply to the data, I haven’t done any in this tip demo.
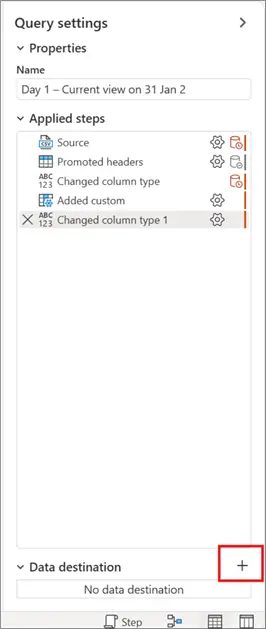
Choose Destination
Then, choose a destination for the transformed data. For the purpose of this tip, I will be using a Lakehouse destination. See the image below on how you would choose the destination.
Once the destination window is opened, you can then choose the destination as seen below.
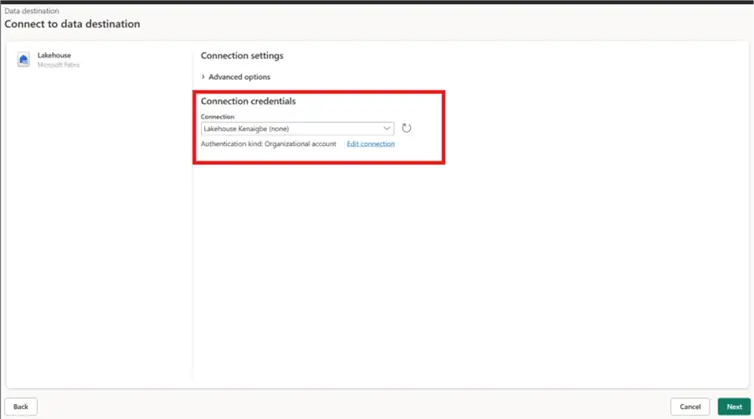
Once I select and authenticated the Lakehouse destination, you will click “Next”. Then you need to navigate to and select the Lakehouse we created earlier as seen in the image below. And since I am creating this table for the first time, I will ensure that “New table” is selected. You might also need to rename you table in the “Table name” area as seen in the image below, I have named mine “daily_incident_table”. Then click “Next”.

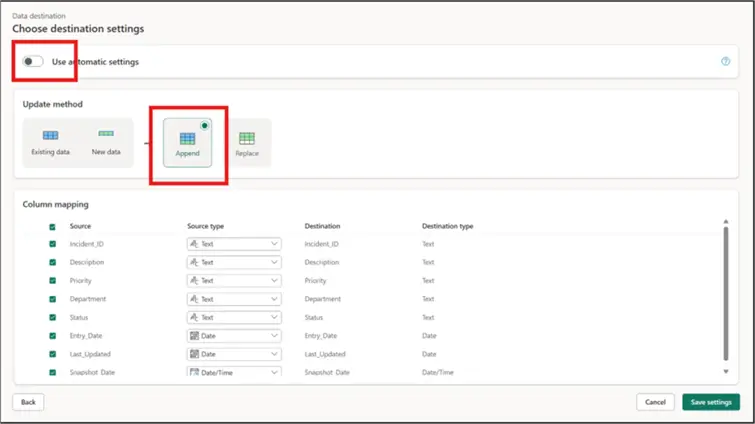
The next window that opens is very crucial, on the “Choose destination settings” window, you will need to toggle the “Use automatic settings” button at the top, then select “Append” as seen in the image below. This is the functionality that would ensure that your data is appended each run and not overwritten.
Save and Run
Then click “Save settings”. This will then navigate you back to the Dataflow Gen 2 window. You are now ready to either “Save” your Dataflow or “Save, run & close” it, or use the other options as seen in the image below.

I have selected the “Save & run” option. The table is created as seen in the image below.
Confirm Snapshot
To confirm that the append logic that generates the snapshots is working, I will run a quick SQL query to view the current “snapshot” datetime, and I will re-run the Dataflow again and also run the SQL query again to see if we are getting snapshot views of the dataset.
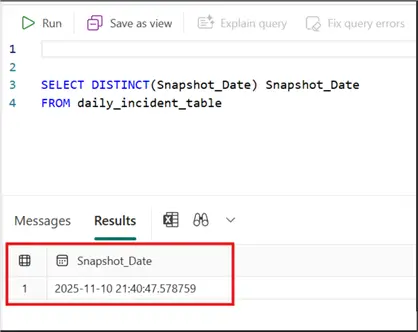
To run the SQL query, I have switched to “SQL analytics endpoint” and used this SQL query:
SELECT
    DISTINCT(Snapshot_Date) Snapshot_Date
FROM daily_incident_table;
As you can see, we currently have a single datetime value for the “Snapshot_Date” column. See the image below.
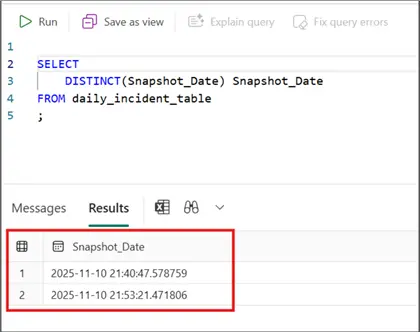
I will now run the dataflow again. And the output after the second run is as seen in the image below.
Summary
It is clear that we have now successfully implemented a snapshot reporting capability using Microsoft Fabric Dataflow Gen 2. Usually, you will now need to schedule the run of the dataflow and then probably create a Semantic model off the table created before using it in Power BI for trends reporting.
There are other approaches to create periodic snapshots of your data in Microsoft Fabric including using Fabric Notebooks and Pipelines. I will write a similar article to demonstrate how to achieve these too.
Next Steps
- Read some more examples on how snapshots reporting is achieved.
- Checkout this YouTube video from Fernan Power BI on snapshots.
- See this YouTube video by Bi Lingual Analytics on historical data.
- Try this tip out in your own data as business requires.

Kenneth A. Omorodion is a Microsoft Certified Solutions Associate (MCSA) with 12+ years of enterprise application experience in Power BI, DAX, Microsoft Fabric, Business Intelligence, data warehousing, SSRS, T-SQL, and Azure. Beyond his technical skills, Kenneth has expertise working with stakeholders’ and business leaders to help them better understand key insights. He has a great track record of successfully delivering full life cycle Business Intelligence and data solutions to organizations with measurable business impact.
- MSSQLTips Awards
- Achiever Award (75+ Tips) – 2025
- Author of the Year-2021
- Author Contender-2022/2023/2024