Problem
Microsoft Fabric is a unified platform for data integration, data engineering, real-time intelligence, and advanced analytics. Fabric is known for providing an integrated way of working with your data, connecting to many diverse types of sources and across the data landscape. How do we get started ingesting and analyzing real-time data streamed over the MQTT protocol?
Solution
MQTT (Message Queuing Telemetry Transport) is a lightweight messaging protocol for the IoT (Internet of Things). One of its core features is the publish-subscribe mechanism, where publishers send messages to a broker, while subscribers receive the messages to which they have subscribed. Fabric supports MQTT as an eventstream source for ingesting, transforming, and analyzing data in real-time, acting as a subscriber.
Key Takeaways
- Microsoft Fabric is a unified platform for data integration and analytics, supporting real-time data ingestion via MQTT.
- To get started, create a workspace and an eventhouse designed for streaming data within Fabric.
- Configure an eventstream to connect to the MQTT data source and define the topic for data flow.
- Use KQL to query the data for insights and visualize the results on a customizable dashboard.
- MS Fabric simplifies the process of ingesting, transforming, querying, and visualizing real-time IoT data from MQTT brokers.
Scenario
I have an IoT device that takes air quality measurements every 145 seconds. The data flows through a container-hosted API publishing the JSON payload to a MQTT cloud broker. The payload is the same every time:

Considering this background, let us configure Fabric to ingest the incoming data and provide analytics on them.
Create a workspace
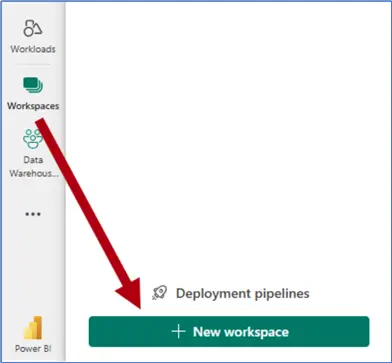
Once logged into fabric.microsoft.com, the first task is to create a workspace. Every Microsoft Fabric workspace is a logical container of resources, designed to group your data stores, pipelines and configurations in one place. To create a workspace, in the nav pane, select Workspaces. Then at the bottom of the Workspace pane that opens, select New workspace:
You must provide a workspace name:
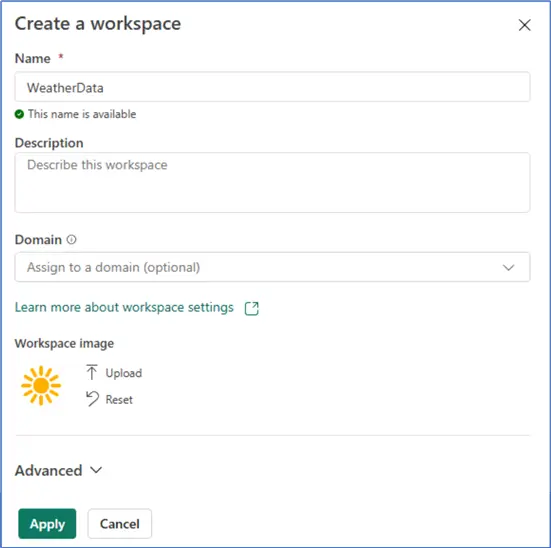
Then click Apply to create and open the new workspace.
Create an eventhouse
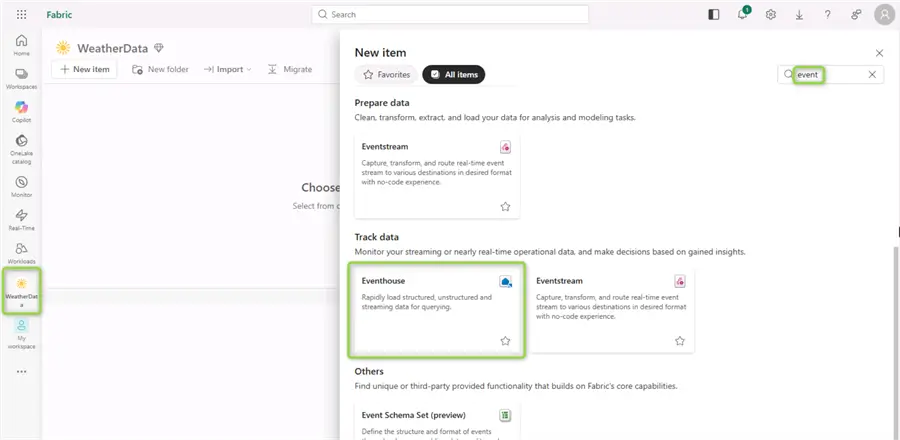
Next, from your newly created workspace, click New Item and find Eventhouse:
Give your eventhouse a name:
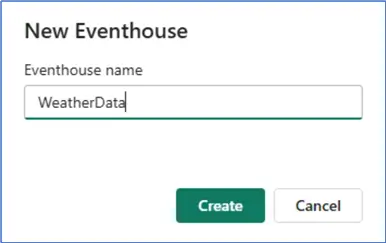
Clicking Create will redirect you to the landing page of your new eventhouse:
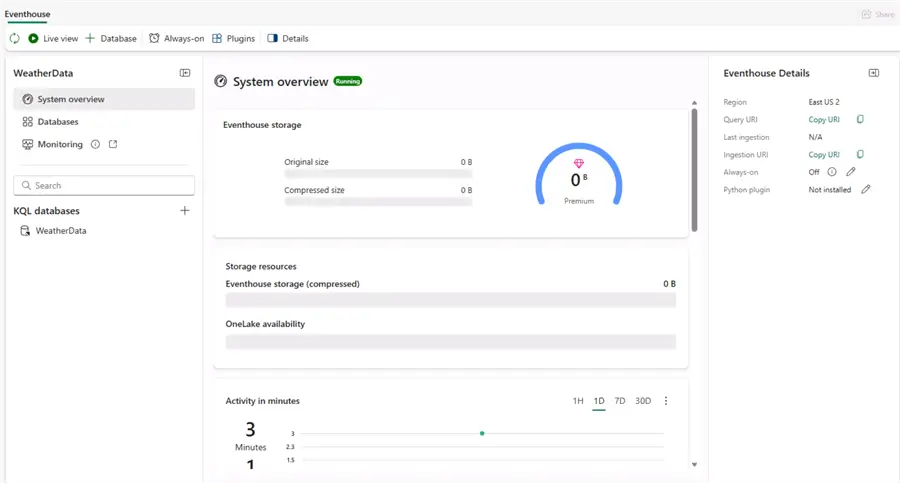
But what is an eventhouse? To explain that, let us take a quick step back. Microsoft Fabric is built on the concept of OneLake – a unified storage foundation. In OneLake, we have different data stores for different use cases. For batch data and semi/structured data, the suitable data store is Lakehouse, while for low latency, streaming data we choose eventhouse. Every eventhouse comes optimized for high velocity streaming data along with a KQL database supporting KQL and SQL queries. Eventhouse is a suitable data store for this scenario.
Create an eventstream
Next, we need to configure how to get data into the new eventhouse. Click on the automatically created database, then on Get Data:
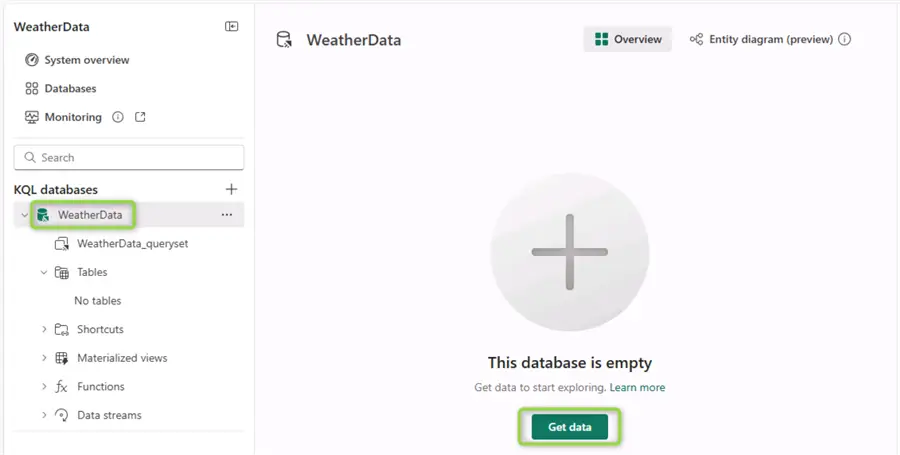
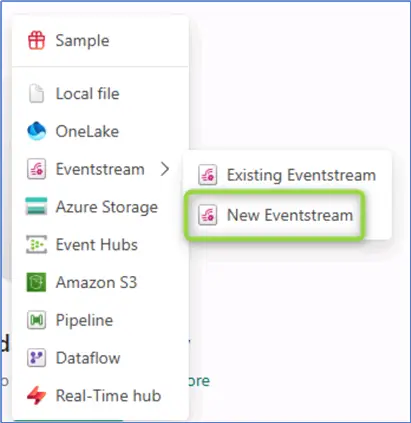
There will be multiple options to choose from. In this case, pick New Eventstream:
Give your Eventstream a name and click Create:
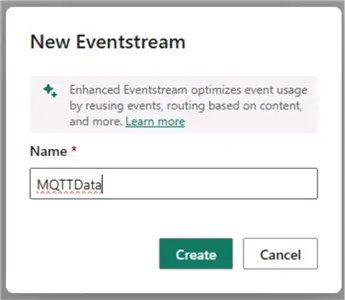
At this point we have a workspace, an eventhouse and an empty eventstream. Now let us move on to creating a data source for the eventstream.
Create data source
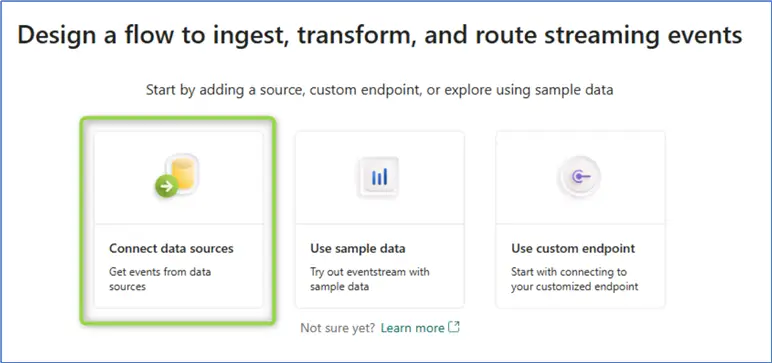
Each eventstream can have one or multiple data sources and destinations. Now let us create our case-in-point data source. From the eventstream landing page, click Connect data sources:
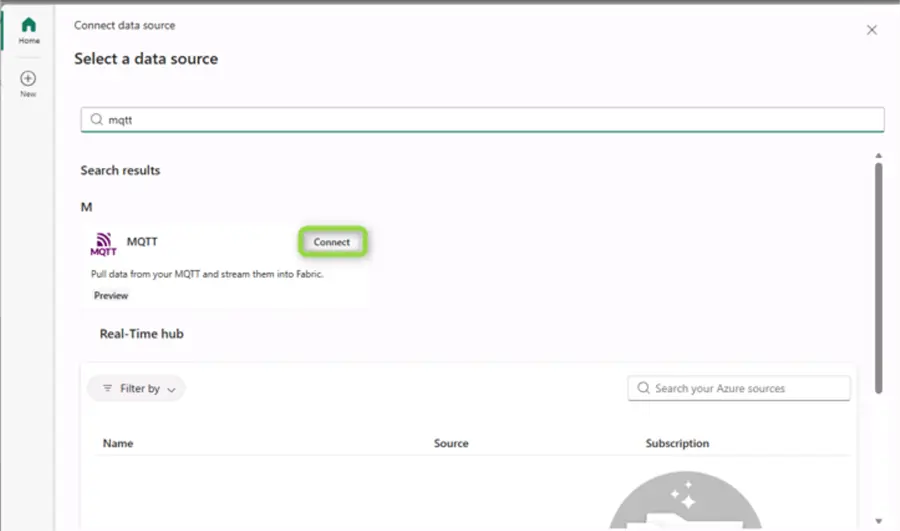
A pop-up will appear asking you to select a data source. Search MQTT and click Connect in the MQTT box:
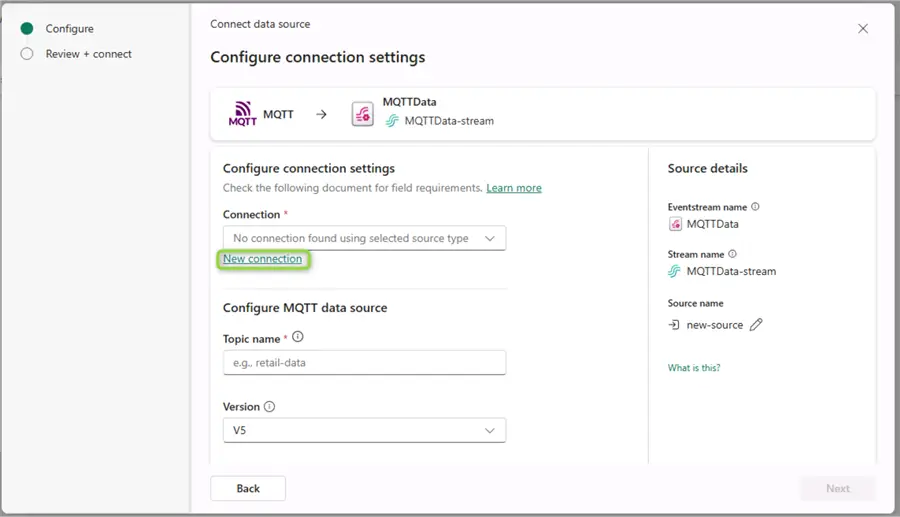
Now we must create a new connection:
The connection pop-up requires the MQTT broker URL, a connection name, the username, and password to the broker. The authentication type for this data source is only one type:
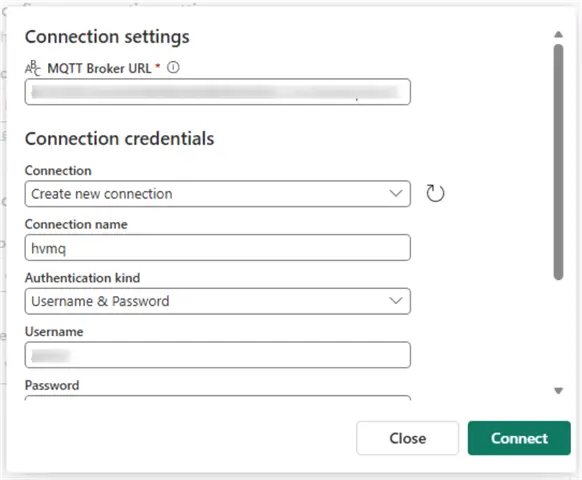
Upon a successful connection, Fabric saves the connection settings.
Configure and review
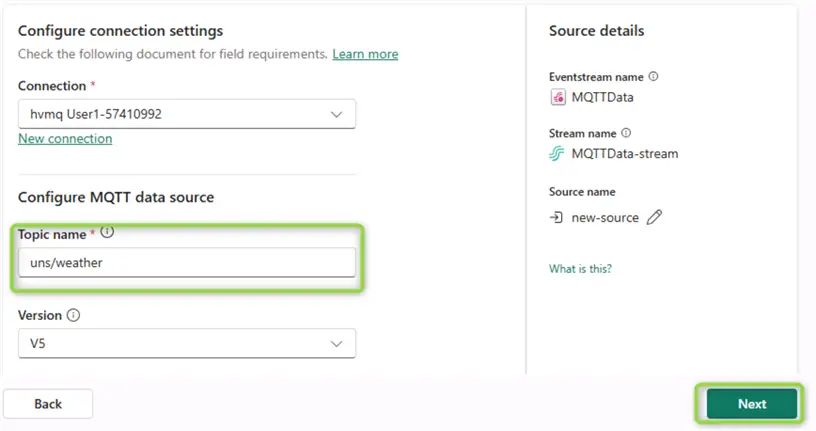
After having the connection configured, we must provide MQTT Topic name. The topic is a string identifier that channels data between publishers and subscribers. In other words, a publisher can publish data to a specific topic, and a subscriber can subscribe to one or many topics. In this case we have a two-level hierarchy, where “uns” is the root and “weather” is the end path we subscribe to. Having configured the topic, click Next:
Finally, the Review and Connect screen will appear, providing a summary of the connection configuration. Note under Define and serialize data it says, “keep data unchanged,” which is the default option and cannot be changed. We can add transformations later, as we will show.

At this stage, we have a connection to the eventstream MQTT data source.
Add destination
Now the data flow overview will be visible on the eventstream canvas. Next, select the Transform events or add destination tile and search for Eventhouse:
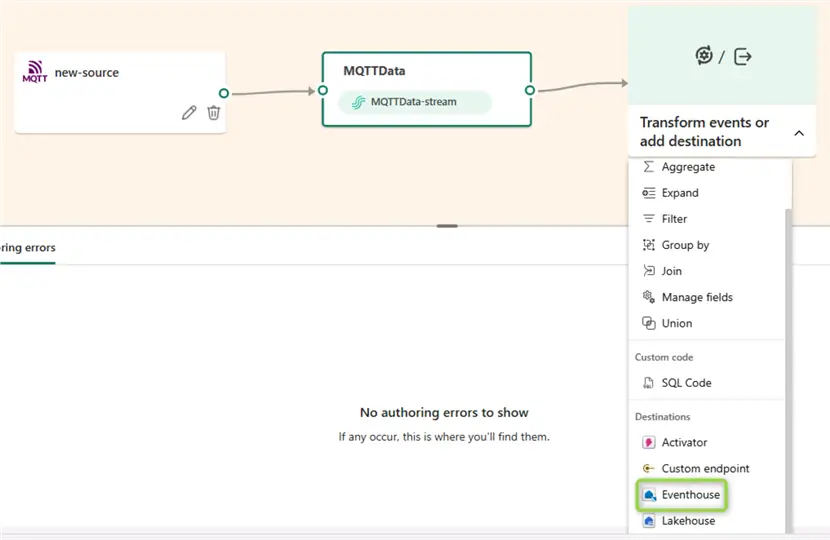
In the Eventhouse pane, configure the following options: Workspace, Eventhouse, KQL Database, KQL Destination table. Our data is coming in as JSON so we keep the input data format unchanged:
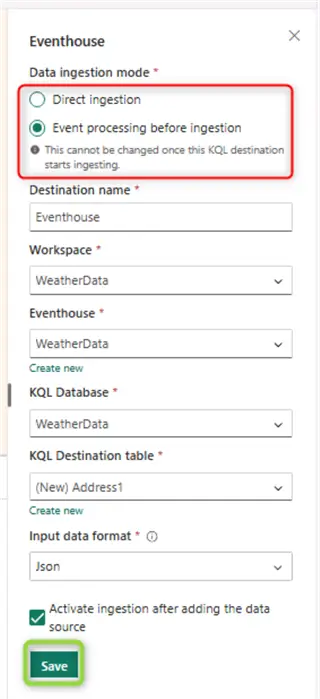
Save your Eventhouse destination settings. Finally, publish your Eventstream changes:

Preview data
We have gradually made it to this point where we can preview the incoming data. First, it will take a while for the Eventstream to create the KQL table based on the previously provided configuration. Then, Fabric marks the eventhouse as “Active.” If the connection to the data source is working, the source action will be highlighted in green:
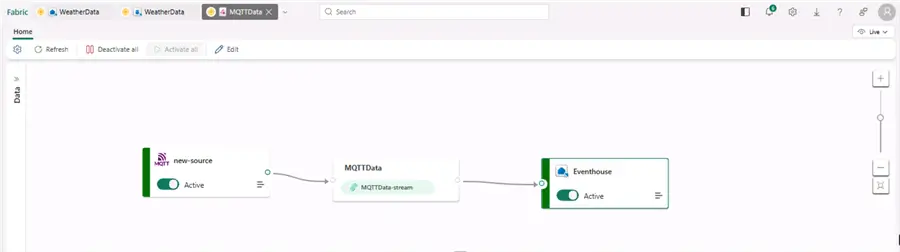
The eventstream flow illustrates the source, stream, and destination. Under the Data preview tab, after refreshing, you should be able to see new data streaming in:

Having completed the steps so far, we will now be able to transform, query, and eventually visualize the incoming data.
Transform data
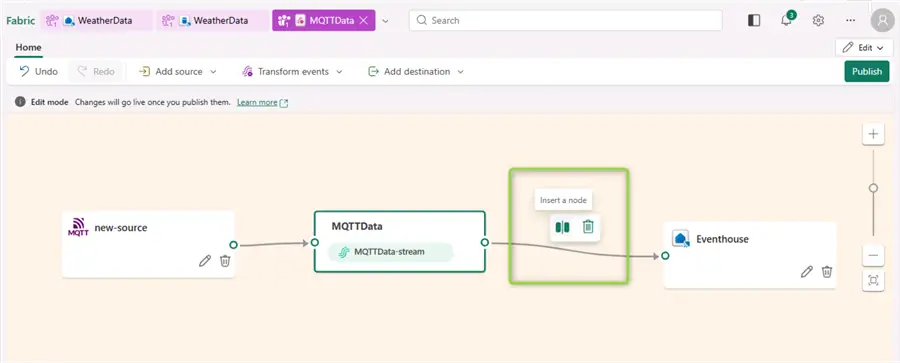
The eventstream also offers several data transformation options, worthy of a more detailed look. The options and configuration mechanisms may look familiar to Azure Data Factory Engineers. For example, let us see how to optimize the data model a bit by removing unnecessary attributes. Open the Eventstream and click Insert a node after hovering over the connection between the data source and the destination:
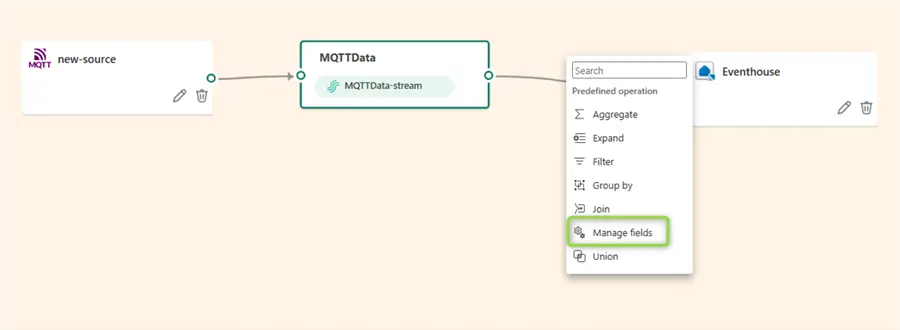
Let us choose Manage fields:
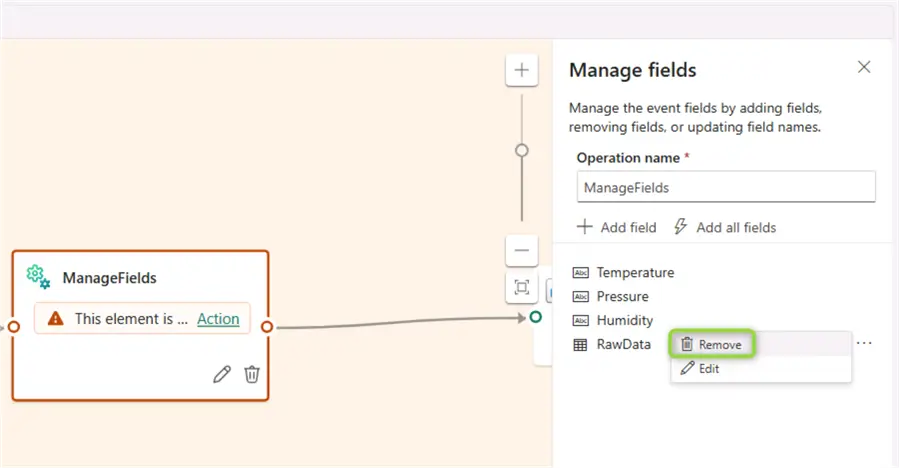
This action will add the Manage fields operation. The action is already contextually aware of the existing fields because it is connected to the source. Let us first remove the RawData field:
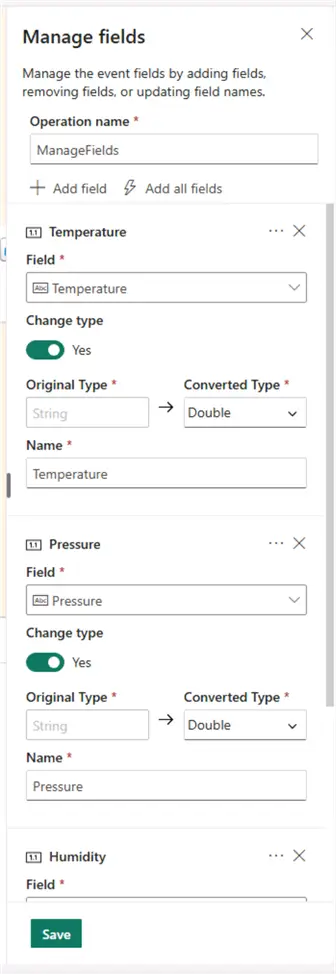
Then for each field Temperature, Pressure and Humidity, let us change the data type by flipping the change type toggle to Yes and selecting the converted type. All original data types are string, while all new types should be double:
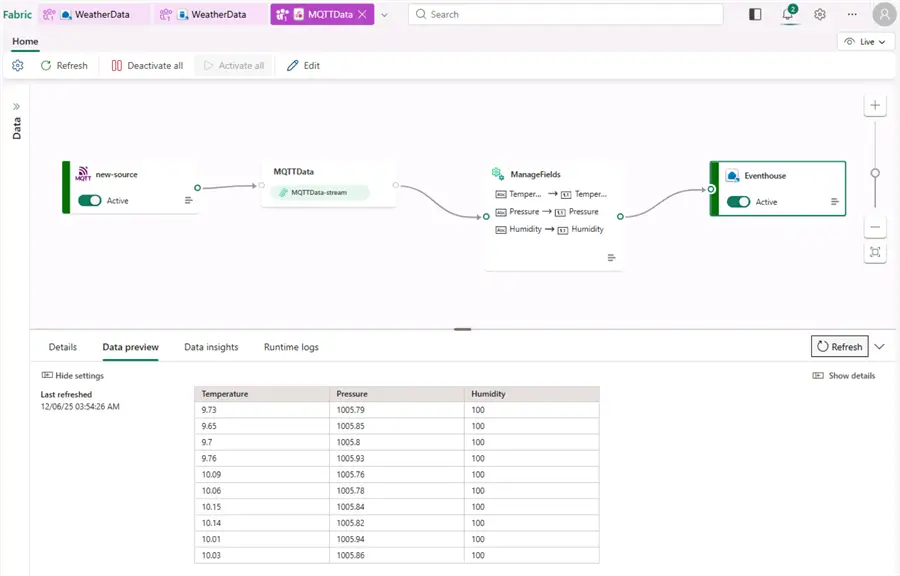
Finally, click Save and Publish. Now here is what the data flow and data preview look like:
Query data
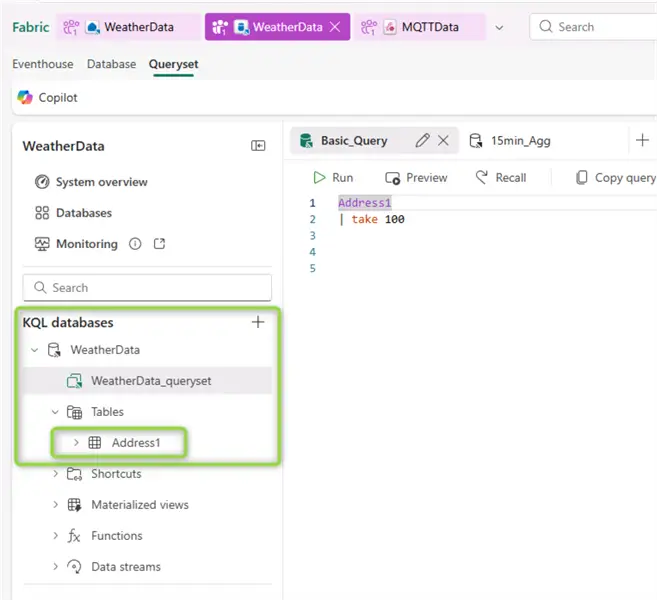
The data preview is handy to see what data are streaming in, but it is not sufficient for querying operations. To query the data, let us head back to the eventhouse. Under KQL Database, under Tables, now we have a newly created table Address1 (names like this in case we want to store data in different tables based on different sensors). On the right-hand side is the KQL query editor, where we can begin writing queries:
Query all data
Let us check what the raw data looks like, taking just the first one hundred records with a simple query:
--MSSQLTips.com KQL
Address1
| take 100

The query gives us a result set accordingly. There are less than one hundred rows because there is still less than that amount ingested. What about more complex operations, such as aggregations?
Aggregate data
Aggregating data in KQL is much like in T-SQL. We need to provide one or many aggregate functions and criteria according to which to group. The former we can do by using the summarize operator and the latter using the bin operator:
--MSSQLTips.com KQL
Address1
| summarize
    MinTemp = round(min(Temperature), 2),
    AvgTemp = round(avg(Temperature), 2),
    MaxTemp = round(max(Temperature), 2),
    RecordCount = count()
by bin(ingestion_time(), 15min)
| order by ingestion_time() asc
This query bins the data at 15-minute intervals of the ingestion time. For every bin, we calculate minimum, average, and maximum Temperature values, as well as a record count:

Had we not transformed the Temperature attribute to double earlier, we might have had to use KQL toreal() to parse the value from string to double in the query itself. At this stage, having aggregated the data at a reasonable interval we can proceed to creating visualizations.
Pin query to dashboard
To visualize the output of this query we can use the Save to Dashboard button. The “Pin query to dashboard” pop-up will ask if we want to use a new or existing dashboard. In this case I will create a new dashboard. I will be able to reuse it later:

Click Create to open the new dashboard:

Note by default, the dashboard visualizes the query result set as a table. We will adjust this a bit later. From the dashboard settings we can click Save (upper left-hand corner) and choose between Live or Editing mode (upper right-hand corner). Now Let us go back to the query set and create a new query for an additional visualization.
Query current temperature
With this next query we only take the most recent temperature value.
--MSSQLTips.com KQL
Address1
| project Temperature
| take 1
| order by ingestion_time() desc
Again, click Save to Dashboard. This time choose the existing dashboard created earlier:

Here is the list of dashboards to choose from:

To make our dashboard complete let us create one more query.
Query recent readings
This final query will format the timestamp and give us the most recent temperature readings. The result set will be suitable for visualizing on a line chart:
--MSSQLTips.com KQL
Address1
| project
    Timestamp = format_datetime(ingestion_time(), 'yyyy-MM-dd HH:mm:ss'),
    Temperature
| order by Timestamp asc
Again, click Save to Dashboard, and again choose the existing dashboard created earlier:

Now we should format the dashboard for a more appealing result.
Format live dashboard
Here is what the dashboard looks like currently with the result sets from the three queries:

All query result sets still appear as tables. Let us edit the table visualizations (Current T and Recent Readings) to something more suitable. Make sure the dashboard is in Editing mode and click the Edit button on the visual. For Current T change the visual type to Stat. Additionally, we can provide a conditional formatting rule to provide a visual clue if the value is above or below a certain threshold. Finally, click Apply Changes.

Let us do the same for Recent Readings. This time choose Line chart:

Once back to the dashboard canvas, we can also resize and rearrange the tiles by dragging and dropping to make the dashboard more appealing. Once done editing, click Save. Here is the final look of my dashboard:

Configure auto refresh
Dashboards in Fabric eventhouses have an auto refresh feature, ensuring visuals refresh as new data come in, without having to reload the whole page. Under the Manage table, click the Auto refresh button. You can enable the auto refresh, then set the minimum time interval and default refresh rate:
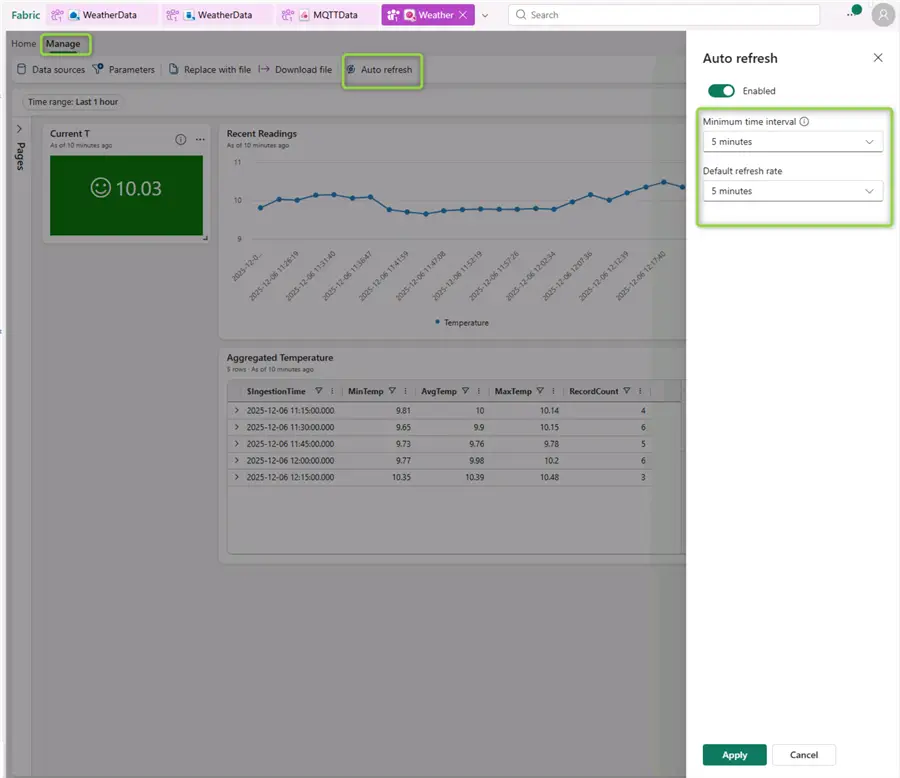
The Minimum time interval defines the fastest refresh rate allowed and acts as a lower limit, while the default refresh rate will be standard or maximum refresh rate. Click Apply and again Save. Now the dashboard will refresh every five minutes. Keep in mind this refresh rate is for the dashboard, not the data source itself. Typically, developers configure the refresh rate in conjunction with the incoming data frequency based on the business need. In this case I have new data coming in every two and a half minutes. Therefore, a five-minute refresh frequency is reasonable to ensure a minimum delay between the points in time of the measurement and of the visualization.
Conclusion
MS Fabric makes it possible and straightforward to ingest real-time data from a variety of streaming data sources. In this document we examined how to ingest, transform, query, and visualize real-time IoT data coming from an MQTT broker.
Next Steps
- Getting Started with Microsoft Fabric
- Microsoft Fabric vs Power BI
- Designing Microsoft Fabric Workspaces

Hristo Hristov is a seasoned data professional with 10+ years of experience spanning the intersection of data engineering and smart manufacturing solutions. Since 2017, he has specialized in implementing advanced analytics solutions for bridging the IT/OT gap.
A technical writer with over 80 published articles on data and AI technologies, Python development, and cloud solutions. Passionate about transforming complex data into business value through innovative applications of Azure Data Platform, Python, IoT solutions, databases, and other cloud technologies.
Currently applying Industry 4.0 best practices, focusing on IoT connectivity, and implementing data and AI systems in manufacturing. Hristo holds a degree in Data Science and several Microsoft certifications covering SQL Server, Power BI, and related technologies.
- MSSQLTips Awards
- Achiever Award (75+ tips) – 2026
- Rookie of the Year – 2021
- Author Contender – 2022/2023/2024/2025