Problem
In a previous tip, I described how we can implement snapshot reporting using Microsoft Fabric Dataflow Gen2. In this article, I will describe how to achieve the same using Microsoft Fabric Pipelines. I previously described how important snapshot reporting can be in Business Intelligence reporting. Some reasons why developers/engineers might prefer to leverage a Fabric pipeline instead of a Dataflow Gen 2 include considerations around cost efficiency and data volumes.
Solution
To ensure this approach is understood and followed by any analyst, I will be demonstrating the process end-to-end from data ingestion to implementing the snapshot datasets. I will bring the data into Microsoft Fabric Lakehouse via Dataflow Gen 2, but we could also do the same via other methods like pipeline, copy jobs, notebooks and event stream.
I will be following the steps below for this tip:
- Ingest the data into my Fabric Workspace
- Load the Dataflow data into a Lakehouse destination table
- Configure the run of the dataflow
- Create an Microsoft Fabric pipeline
Prerequisites:
- You have a Microsoft Fabric trial or paid license
- You have created a Microsoft Fabric Workspace or have an existing Workspace
- You have created a Microsoft Fabric Lakehouse in the Workspace
STEP 1: Ingest data into my Microsoft Fabric Workspace
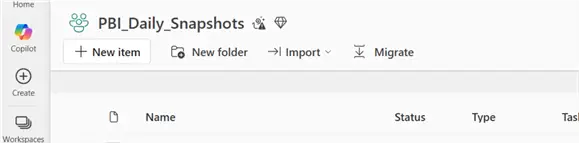
I am using a workspace in Microsoft Fabric called “PBI_Daily_Snapshots” as seen in the image below.
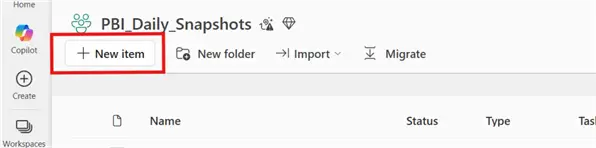
To get the dataset into Microsoft Fabric workspace, I will need to click on the “New item” and select “Dataflow Gen 2” from the list of connectors as seen in the second image below.

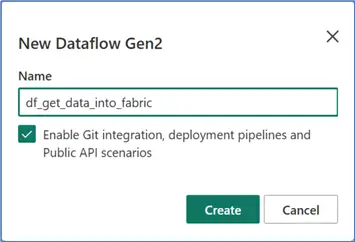
Once clicked you should get the pop-up as seen in the image below where you need to enter a name for the Dataflow. Then click “Create”.
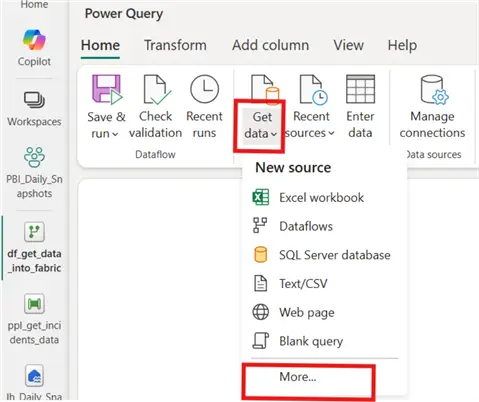
Within the dataflow, I will now click on “Get data” to connect to my dataset in OneDrive as seen in the image below. Then click on “More”. I will not be dwelling on how to get the data so much since your dataset might be in a different source and the main purpose of the article is to show how the snapshots are done.
As can be seen in the image below, the data is now ready in Power Query (Dataflow Gen 2). Once all data transformations and cleaning are completed, you can then move to step 2.

STEP 2: Load the Dataflow data into a Lakehouse Destination Table
Having ingested the data using Dataflow Gen 2, I will now proceed to loading it into a destination table. In this demonstration, I will be loading it into a Microsoft Fabric Lakehouse table.
First, I will click on the “+” sign at the bottom right of the dataflow and then select the “Lakehouse” destination as seen in the image below.
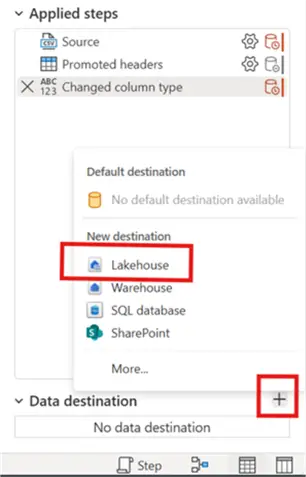
I will then either create a new connection or leverage the connection existing as seen in the image below. Then click “Next”.

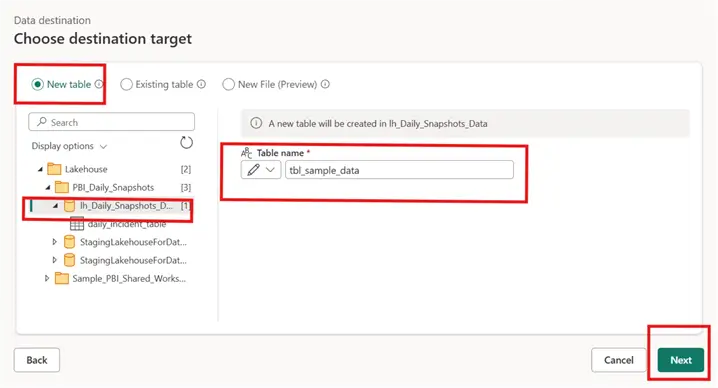
Then, on the new window, you should ensure “New table” is selected, then navigate to the Lakehouse where you need to save the table on (remember this was a prerequisite earlier). If you don’t know how the Lakehouse is created, you can see this Microsoft Documentation. You should also determine what to name your destination/target table here as seen in the image below where I named mine “tbl_sample_data”.
After this, you should click on “Next” as seen in the image below.
In the next window, just click on “Save settings” and then “Save, run & close” the dataflow.
Once the dataflow runs, the table should now be created and populated with data as seen in the image below.

However, this table will always be overwritten on each run and that would not meet the need of having daily or periodic snapshots of the data. This will be described in step 4, but for now, I will describe how you can schedule the run of your dataflow.
STEP 3: Configure the Dataflow Schedule
You will need to configure the dataflow to run periodically to ensure the table is populated with up-to-date data.
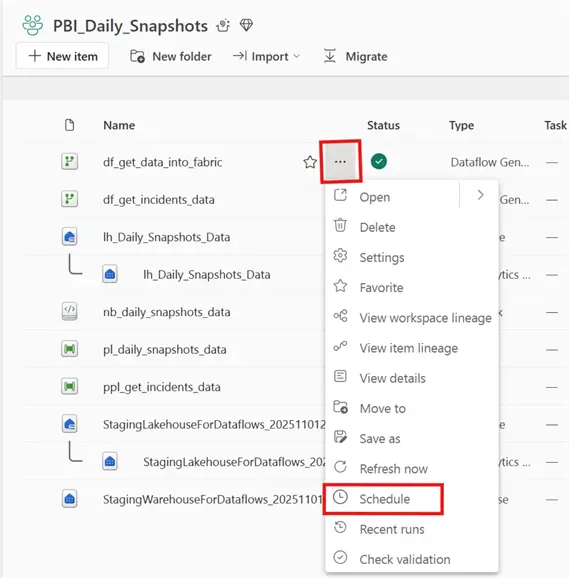
To configure your dataflow (if you are using this approach), just click on the ellipses at the end of the dataflow and then click on “Schedule” as seen in the image below.
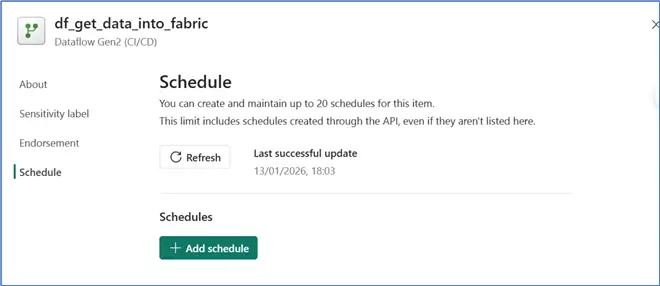
On the next window that opens, just click on “Add schedule” as seen in the image below.
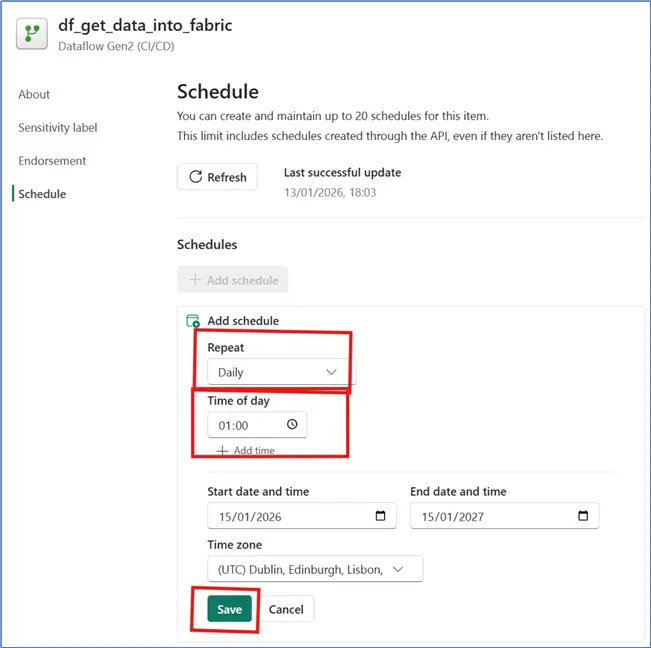
On clicking “Add schedule”, you should now configure the schedule as required as seen in the example I provided in the image below. Then click “Save”.
STEP 4: Create a Microsoft Fabric Pipeline
This is the step where the magic will be done. You will add a new column that will merge a date column to your table each time the pipeline runs (depending on the run schedule configured on the pipeline) and load this into a new table that will be created using Microsoft Fabric pipelines.
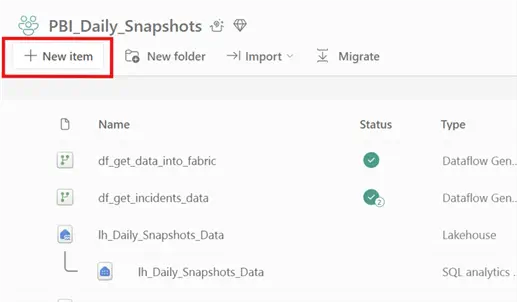
To create the pipeline (see this Microsoft documentation), go to your workspace and then click on the “New item” tab as seen in the image below.
Next, on the opened window, you can either scroll to find “Pipeline” or type it on the search box and select the first option as seen in the image below.

On the window that pops-up, just enter a name for the pipeline, I have named mine “ppl_get_incidents_data”. Once created, open it and on the “Activities” tab, click on the dropdown on the “Copy data” activity and select “Add to canvas”. Note: you can also use the copy assistant if you prefer. See the image below.

On the window that opens, you can choose to configure the “General” tab to enter a name and description for your pipeline (which is best practice) as seen in the image below.

Configuring Source and Destination
The main tabs will be configuring for this task are the “Source” and “Destination” tabs.
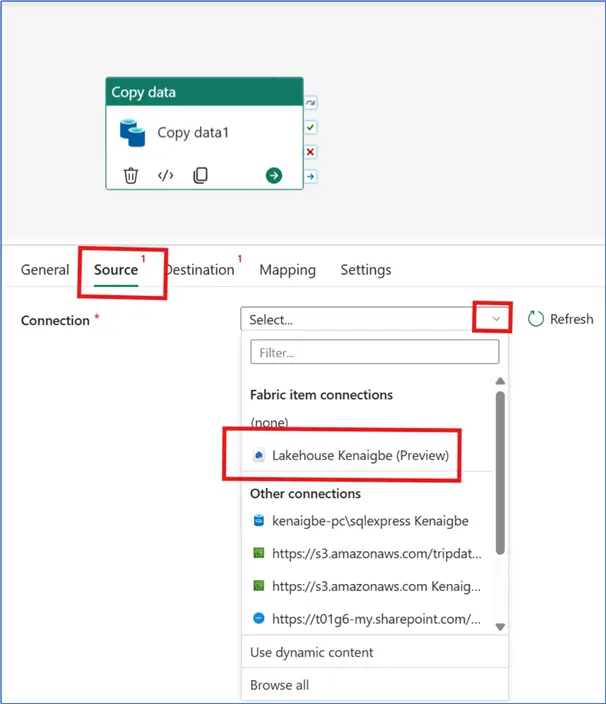
With the “Source” tab, I will need to select the tab and then click on the dropdown on the “Connection” and then select a connection from the list as seen in the image below. In this case, I have selected the “Lakehouse” connection, because the table I created earlier using the dataflow Gen 2 was created in a Lakehouse.
Once the connection is selected, you should get additional prompts to configure the Lakehouse name and the Table name.
For the “Lakehouse” name, just click on the dropdown on the cell and select the name of the Lakehouse you have created earlier where you have created the “tbl_sample_data” table (in my case I named it “lh_Daily_Snapshots_Data”) as seen in the image below.

Do the same on the “Table” by clicking on the dropdown and selecting the table we created using the Dataflow Gen 2 earlier as seen below.

After selecting the source table, we need to expand the “Advanced” section. This is where we perform some of the magic. Here is where we need to be creative, we want a new table that pulls data from the table we created using Dataflow Gen2 and then adds a new column (date or datetime column) each time it runs. See the image below.
Source Settings
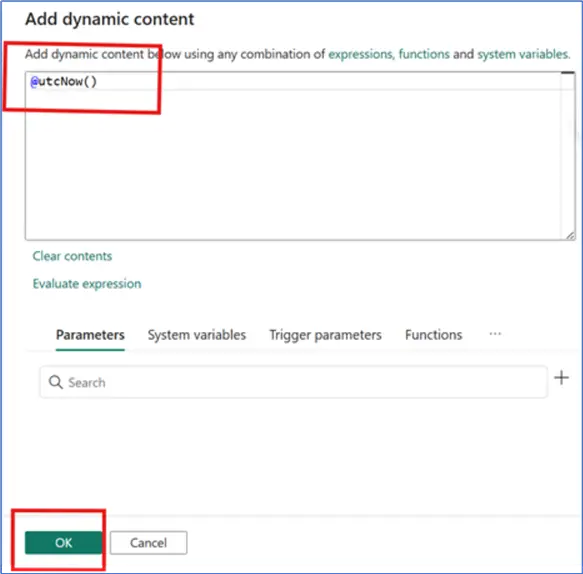
In the image below, after expanding the “Advanced” section I will then go to “Additional columns” and add a new column I have named “DateTime_Snapshot”. On the “Value” cell I can either click on it to pop-up a new window where I will enter my dynamic content expression or I can also leverage a parameter here which is a best practice for production solutions.

For the purpose of this article, I will just enter my expression in the pop-up window as seen in the image below.
Destination Settings
Next, we need to configure the “Destination” tab. This is where the final magic of this task is completed. As with the “Source” tab, I will click on the dropdown on the “Connection” cell and select a Lakehouse destination. You can choose to select any other destination of your choice at this point. See the image below.
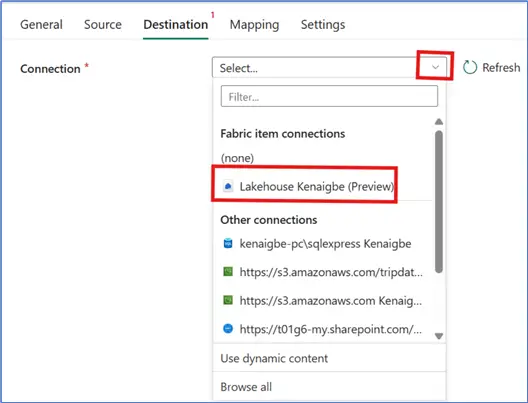
Again, as in the case of Source configuration, you will get additional prompts after you select your destination connection. The first of these is the destination Lakehouse (since I selected a Lakehouse destination) and in this demo I am using the same Lakehouse I used for source, yours might be a separate Lakehouse. See the image below.

The second prompt is for the destination table. This is how we capture a snapshot of each period of the data run.
To do this, click on “New” as seen in the image below.

In the pop-up that opens, enter a “Schema” (Optional) and a “Table” name (Mandatory). In my case I will leave the schema as “dbo” and the table name as “tbl_sample_data_snapshots”. Then click “Create”.
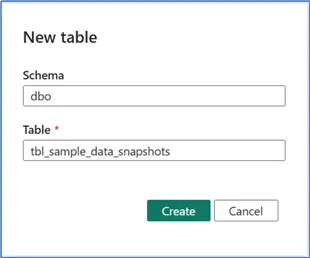
Once the table is created, just ensure the “Table action” is set to be “Append” as seen in the image below.

Validate Pipeline
After this, you just need to validate the pipeline as seen in the image below.

If the pipeline is completed correctly, the message should be something as seen below. Then close the message.

Next, you will now need to “Save”, “Run” or “Schedule” the run of your pipeline as in the image below. I have described how you can schedule runs earlier when we did an example for the Dataflow Gen2 we created earlier.

As you can now see in the image below, the two tables now exist in the dbo schema on the Lakehouse.
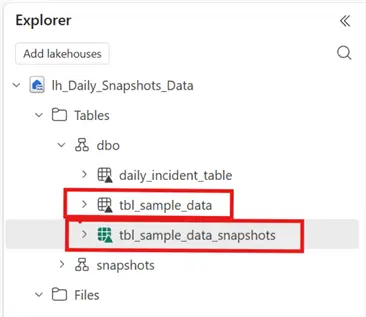
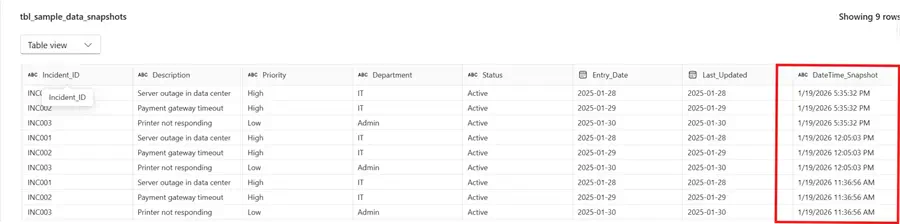
If you run a query on the “tbl_sample_data” table, you would not find the snapshot dates, but on the “tbl_sample_data_snapshots” table, the snapshot dates will exist and will keep appended on each run of the pipeline.

Summary
In summary, I have demonstrated an approach on implementing a snapshot capture of your data using Microsoft Fabric Pipeline. It should be noted that apart from leveraging a Microsoft Fabric Dataflow Gen2 or Microsoft Fabric Pipeline, we can also achieve the same using a Microsoft Fabric notebook, but I will write another demo to describe how to achieve this.
It is also important to note that, your scenario might be different to what has been described in this blog post in that you might already have your data tables existing in Microsoft Fabric and you just needed to implement a snapshot capture of your dataset. In that case, the process is the same as described in this blog post, you might just have to start from step 4.
Next Steps
- Read more examples on how snapshots reporting is achieved.
- Checkout my previous blog tip on implementing snapshot data capture using Dataflow Gen2.
- Read this Microsoft Documentation for more on how to create and utilize an MS Fabric Lakehouse.
- Read more on Microsoft Fabric Pipelines.
- Try this tip out in your own data as business requires.

Kenneth A. Omorodion is a Microsoft Certified Solutions Associate (MCSA) with 12+ years of enterprise application experience in Power BI, DAX, Microsoft Fabric, Business Intelligence, data warehousing, SSRS, T-SQL, and Azure. Beyond his technical skills, Kenneth has expertise working with stakeholders’ and business leaders to help them better understand key insights. He has a great track record of successfully delivering full life cycle Business Intelligence and data solutions to organizations with measurable business impact.
- MSSQLTips Awards
- Achiever Award (75+ Tips) – 2025
- Author of the Year-2021
- Author Contender-2022/2023/2024