By: Arshad Ali | Comments (12) | Related: > Microsoft Excel Integration
Problem
In my last tip, I talked about Power View, a new tool for intuitive ad hoc reporting which provides an interactive data exploration, visualization, and presentation experience to the business users. I demonstrated how you can configure and create Power View reports in SharePoint. In this tip we cover how to use Power View for Excel.
Solution
Power View in Excel 2013 is a new Add-in for intuitive ad hoc reporting which provides an interactive data exploration, visualization, and presentation experience to the business users or users with all skill levels. It allows the user to create different types of reports including tables, matrices, maps, and a variety of charts in an interactive view based on the data model (a data model is a collection of tables or entities and their relationships that reflects the real-world business scenarios like a sale is related to product sold to a customer etc.) internal to Excel or external data sources.
A Power View report in Excel can be based on a data model internal to an Excel workbook or external data sources including PowerPivot, tabular data model, etc...
A single Excel workbook can contain multiple Power View reports or sheets, and each of these reports or sheets can be based on a different data models. Each Power View report or sheet can have its own charts, tables, and other visualizations as required. Even Copy-Paste operations work well across different reports or sheets of the workbook if these two reports or sheets are based on same data model.
Please note, Power View and PowerPivot are only available in the Office Professional Plus and Office 365 Professional Plus editions. To start using the Power View add-in, we first need to enable it as mentioned below.
Enabling Power View Add-in Excel 2013
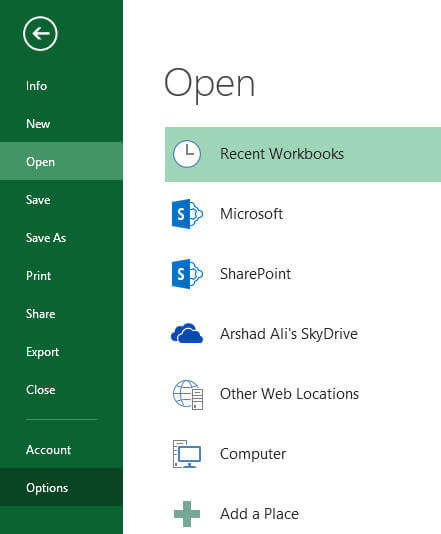
To enable Power View Add-in go to File and then click on the Options menu item as shown below:
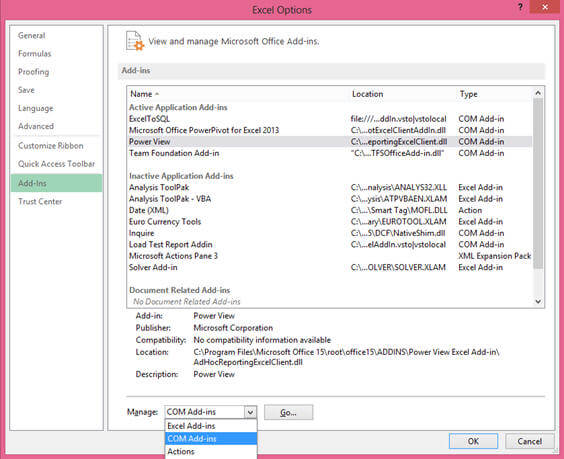
From the Excel Options, click on the Add-ins page as shown below, select COM Add-ins from the Manage combo-box and click on the Go button.
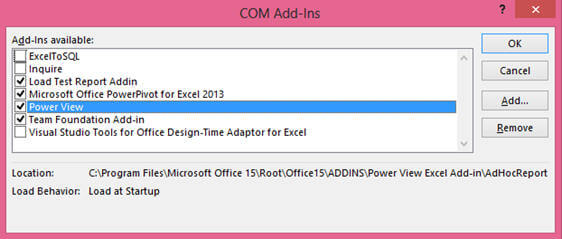
Now check the radio button next to Power View and then click on OK and then OK again.
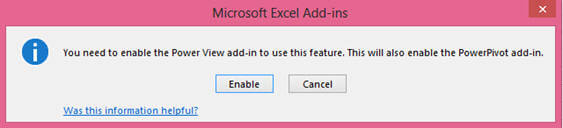
If you try inserting a Power View sheet without actually enabling the Power View Add-in, you will be prompted with this message, click on the Enable button to enable the Add-in. This is another way of enabling the Add-in and you don't necessarily need to do it by going through the steps as mentioned above.
Creating Power View Reports in Excel 2013
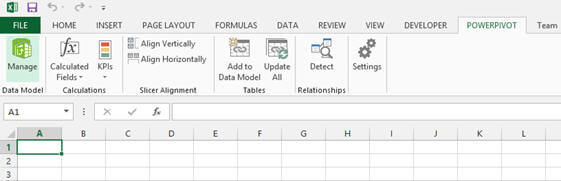
In this demonstration, I am going to use AdventureWorksDW2012 database to pull data into PowerPivot data model first (though this is not necessary, you can create reports based on the data in workbook or data pulled from a database directly) and then create Power View reports based on that model. Please go to the PowerPivot tab and then click on the Manage icon as shown below:
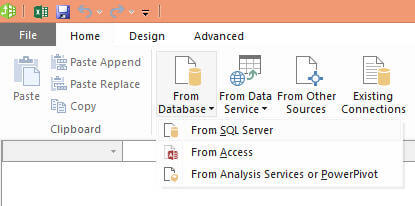
In the PowerPivot window, click on the From Database icon and then click on From SQL Server menu item as shown below:
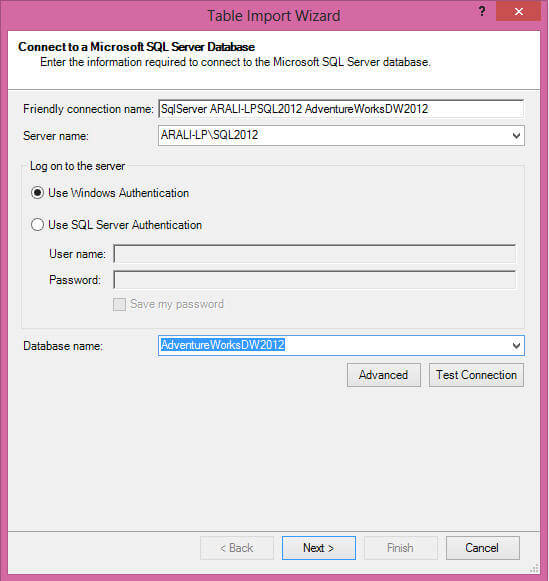
Clicking on the above will launch the Table Import Wizard as shown below, you need to specify a Server Name and credentials to connect to the specified server. Click on Test Connection to check if you can connect to the specified source.
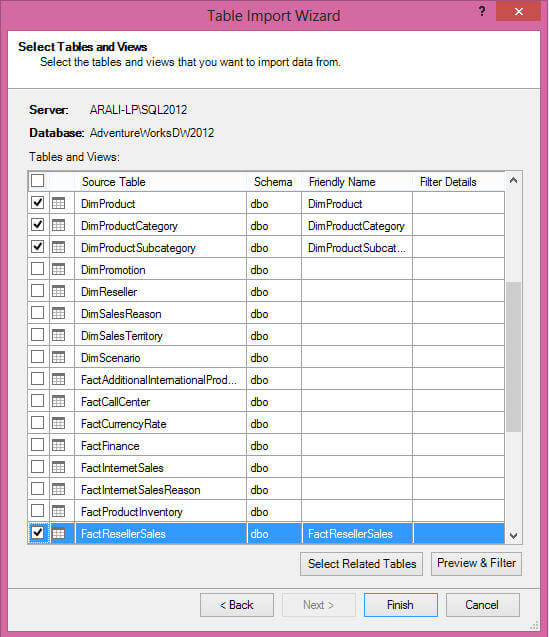
On the next screen of the wizard, you can specify if you want to pull data directly from tables or views or if you want to write a query to pull data from the source. As I selected to pull data from tables or views, here you can see a list of tables or views which I can now include to bring data from:
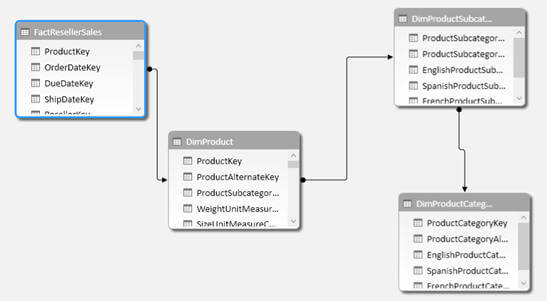
Here is the data model which I created for demonstration purposes, as you can see it is quite a simple model (for simplicity in demonstration though you can create a complex model and it works fine) with FactResellerSales, DimProduct, DimProductSubCategory and DimProductCategory.
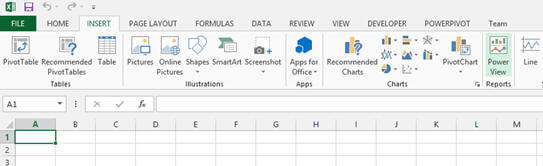
Now return to Excel, go to the Insert tab and then click on the Power View icon as show below:
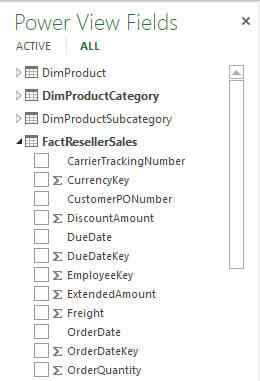
The Power View designer will open and on the right side of the designer you will notice all the entities from the selected model listed under Power View Fields as shown below:
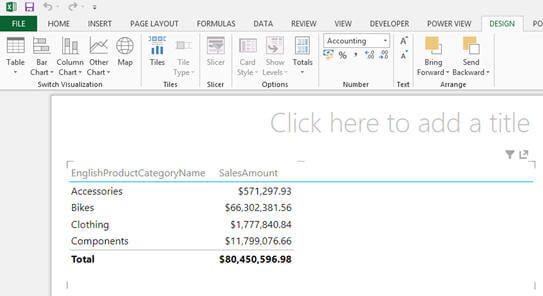
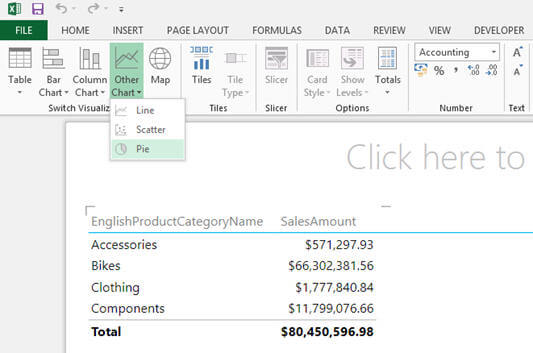
Now you can drag or check\select fields to do ad-hoc reporting. I selected Product Category and Sales Amount (to analyze sales amount by product category) and this is how this report should look like.
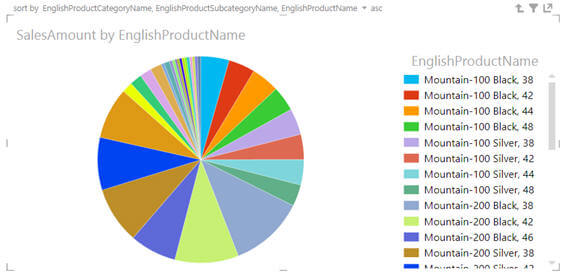
Its just a click away, if we want to change the report type; simply select the table and from the Design tab select from the varieties of options available. For example, in my case I chose Pie Chart as shown below:
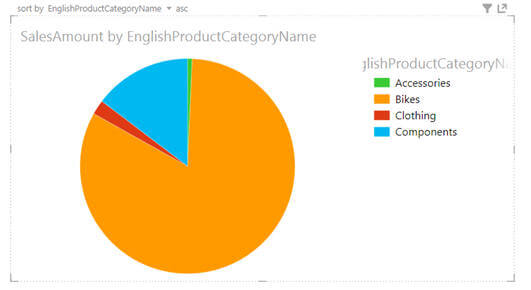
And here is the result of the above selection, in just one click the tabular report turned to a pie chart report.
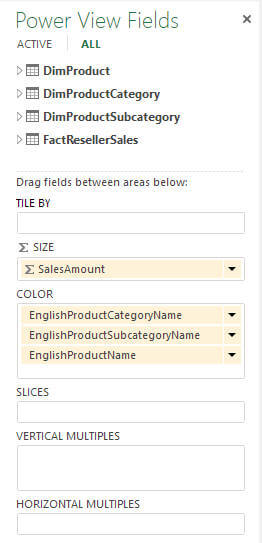
Now I want to add drill down capability to my report. I want to have a pie chart report as above but clicking on any part of the pie at the Product category level, I want to drill down to the Product Sub Category level and then to the Product level. Again its quite simple and easy, just drag Product Sub Category under Product Category and Product under Product Sub Category in the Color section of Power View Fields as shown below:
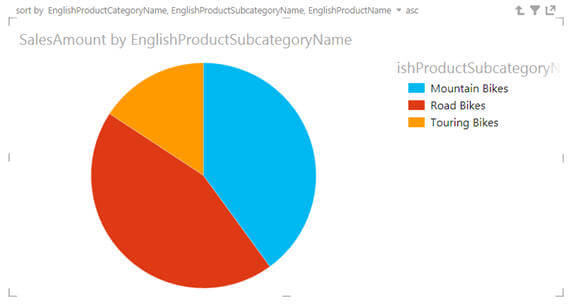
Now click on the any part of the pie or product category in the chart and it will take you to another pie chart of product sub categories under the selected product category as you can see below:
Likewise, clicking on the any of the pie or product sub category of the above chart will take you to another pie chart of products under the selected product sub category as you can see below:
In order to drill up, you can click on the Drill up icon, which is shown below, and this is available on the right top corner of the report.
Creating Power View Map Reports in Excel 2013
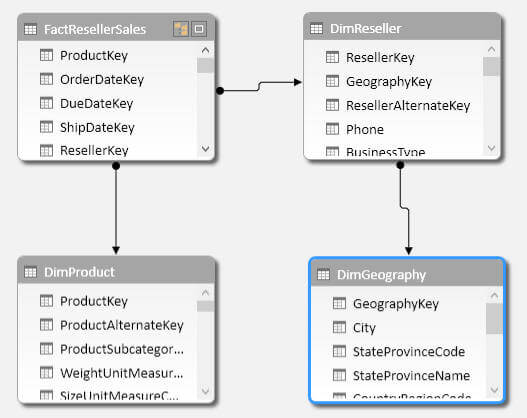
Now let's create some cool Power View map reports. For this demonstration, I have pulled FactResellerSales, DimResellers, DimGeography and DimProduct as you can see below:
Simply drag Sales Amount and Country from the Power View Fields list and your report should look like as shown below:
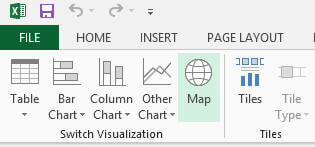
To turn the above tabular report to a map report, simply go to Design tab and then click on Map icon as shown below:
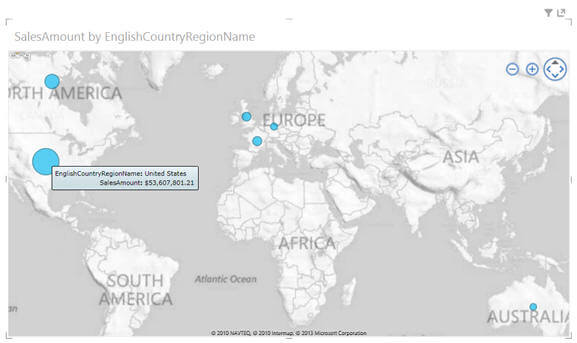
That's all and here is your first map report for the sales. Hovering on any of the circles will provide the detail information as shown below; also the size of the circle indicates the value with respect to the other values for the report:
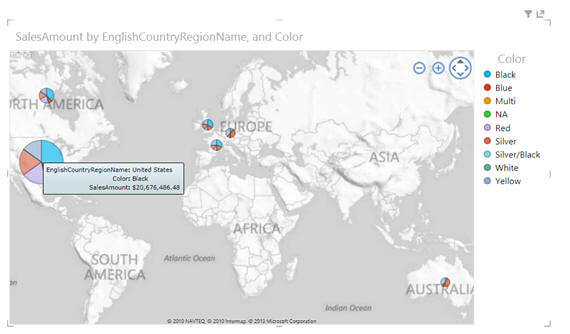
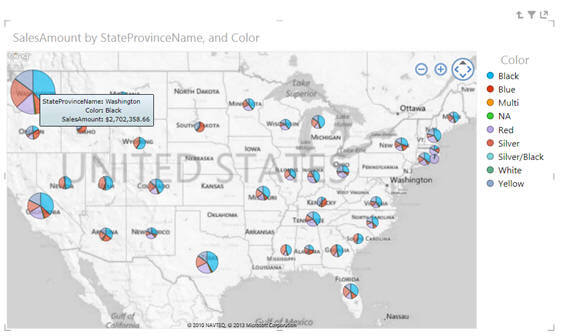
What we see in the above report is total sales amount country wise; lets change it to show total value but dividing among different colors of the products. To achieve this, we just have to drag Color attribute from DimProduct dimension to Color section in the Power View Field list as shown below:
And this is how the report should look; as you can see each pie of the chart represents the sales amount for each product color.
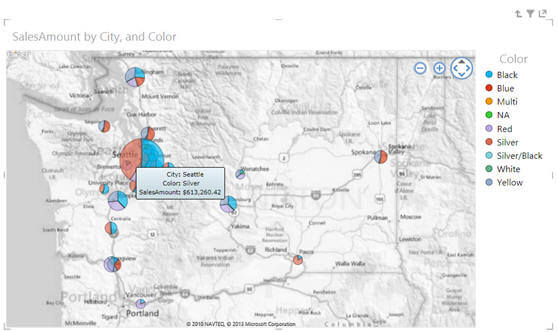
You can also follow a similar approach, as discussed above, to create a drill down map report as well. So basically, what I want is to drill down from country to state and then to city for analyzing sales amount. Here is what you can see after drillling down from country (US) to state wise sales amounts.
Here is what you can see after drillling down from state (Washington) to city wise sales amounts.
Next Steps
- Review my last tip, Getting started with Power View Reports with SharePoint, Excel and SQL Server on the series.
- Review my last tip, Teach Business Users How To Create Power View Reports With SQL Server Data Sources tip.
- Review Power View on msdn.
- Review my previous tips


About the author
 Arshad Ali is a SQL and BI Developer focusing on Data Warehousing projects for Microsoft.
This author pledges the content of this article is based on professional experience and not AI generated.
View all my tips
