By: Siddharth Mehta | Comments | Related: > Microsoft Excel Integration
Problem
Identifying and incorporating required fields is a regular part of any report development process. For business users who frequently develop ad-hoc reports using tools like Power View, it becomes an integral part of their day-to-day job. Mostly there are certain mandatory or frequently used fields which are part of every report irrespective of the purpose of the report. If such field selection in the report can be automated, this can save significant time for the user as well as make the report development process more efficient by reducing the possibility of errors.
Solution
The SQL Server Analysis Services (SSAS) 2016 Tabular model provides reporting properties for any table in the model, which facilitates configuration of default field selection behavior for each table.
In this tip we will look at a particular scenario where we will automate the field selection from a particular table in a Power View report. Follow the steps below to achieve this goal:
Step 1 - We need a sample SSAS Tabular model to create a Power View report. I have the AdventureWorks 2014 Tabular Model installed on my machine. You can download the sample from here, and install it on your development machine.
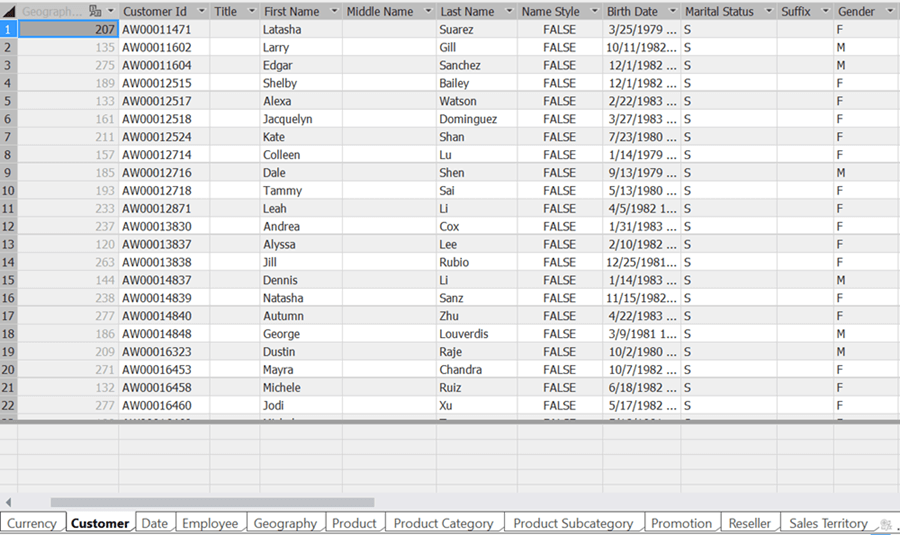
Step 2 - Open this model in the Visual Studio Data Tools, and click on the Customer table. You should be able to see the data as shown below.
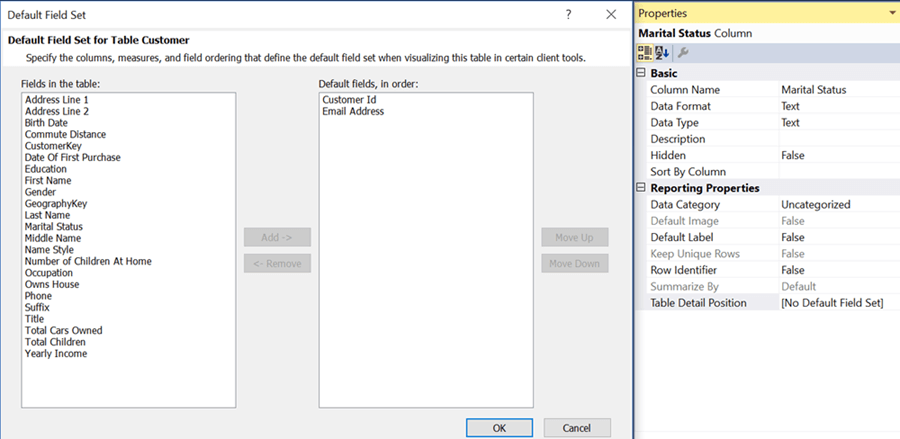
Step 3 - Navigate to the properties window by selecting properties of any column, and click on the Table Detail position property. Let's say that business users need CustomerID and Email Address as a part of any report that uses the Customer table. So select these fields as a part of the default field set for this table as shown below.
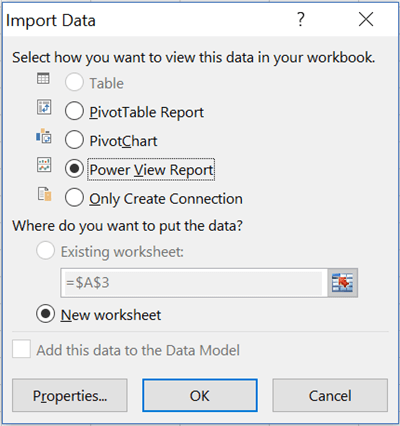
Step 4 - Process and deploy this model on your SSAS server. Once deployed, open Excel and create a connection to the SSAS database which we deployed in the last step, and connect to the model. Next, click on the Data > From Other Sources > From Analysis Services menu option. When the Import Data screen loads with the options to create a PivotTable Report / PivotChart / Power View Report / Only Create Connection, select the option to create a Power View Report.
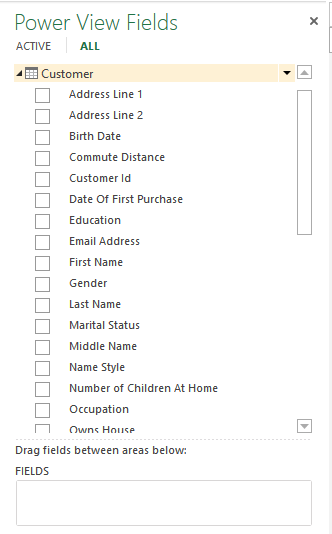
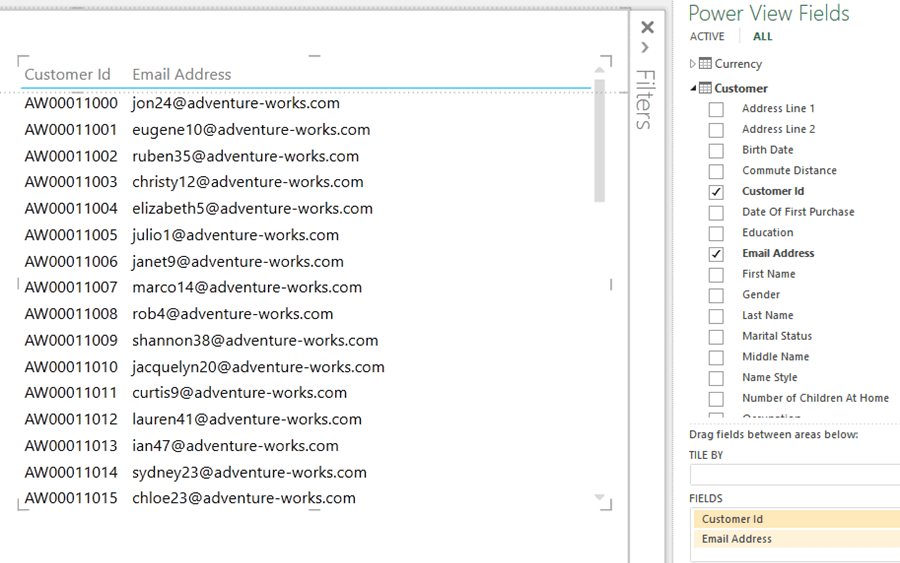
Step 5 - In your new Power View Report, you should be able to see different tables and a list of fields from your model. The table of interest for us is the Customer table as shown below.
Step 6 - Our prime intention is to automate the selection of the fields for the business user, so that the user does not have to find and select the frequently used fields every time. Just click once on the Customer table, and it will add the configured fields to the list of selected fields as shown below.
In this way we can configure the behavior of the table during design time such that reporting clients can use it to build their reports.
Next Steps
- Explore the rest of the Power View reporting properties available for the table, and learn how they can be used the optimize the reporting experience for the user.
- Check out other Power View tips


About the author
 Siddharth Mehta is an Associate Manager with Accenture in the Avanade Division focusing on Business Intelligence.
This author pledges the content of this article is based on professional experience and not AI generated.
View all my tips
