Problem
We have been running SQL Server instances in AWS for some time now and we would like to measure performance. We have heard about AWS CloudWatch and how it provides some out-of-the-box performance counters. We did have a look and although good, it doesn’t give us the full picture. Is there some way we can get Windows performance counter values in CloudWatch?
Solution
More and more companies are moving their workloads to the Amazon cloud and SQL Server deployments in AWS are fairly common now. Companies adopting this model see some obvious benefits, such as:
- Low cost infrastructure provisioning
- Simplified backup process
- Flexible network design
- Access to 24×7 support
- and more.
As DBAs find themselves in the ever expanding world of cloud computing, they have to go through some learning curves to stay relevant in the market. Some of the traditional DBA tasks haven’t really changed, but they have to be aligned with the way the underlying infrastructure works. One of those core tasks is performance monitoring.
Companies often significantly invest in third-party monitoring and alerting solutions, which can sometimes become a very costly initiative. Unless there is already a dedicated database monitoring tool in place, DBAs typically have to make use of existing modules or add-ons that come with the chosen toolset. For a small data services team, it’s often challenging to justify the business case for a dedicated database monitoring solution. Even when the business understands the need, it’s often cost-prohibitive for small to medium sized companies to buy a third-party product.
AWS CloudWatch
AWS CloudWatch is a core web service in the Amazon cloud platform. CloudWatch provides some ready-made performance counters for each type of AWS services like EC2 instances or EBS volumes.
When it comes to hosting SQL Servers in AWS, customers can either choose the managed platform, RDS, or use their own virtual servers. These virtual machines are called Elastic Compute Cloud (EC2), and they run on Amazon’s own hardware. Hosting a SQL Server in AWS EC2 is similar to running a SQL Server instance on a VMWare virtual machine. With EC2 however, customers can choose how the storage media attached to the server will perform. The storage volumes that are attached separately to an EC2 server are called Elastic Block Storage (EBS) volumes and they can come in either SSD or magnetic media format. Most importantly, it’s possible to provision the volumes with a pre-defined performance throughput. This performance throughput is called IOPS (Input Output Per Second).
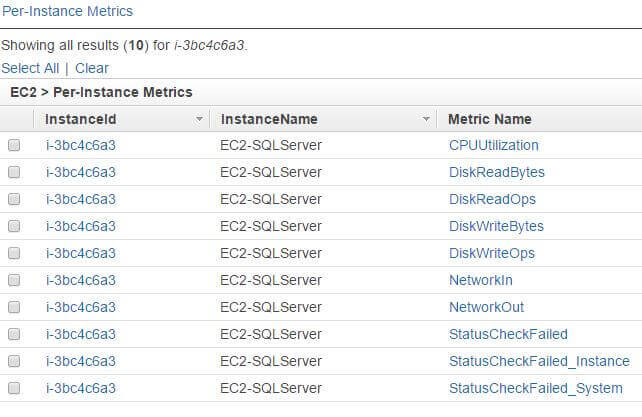
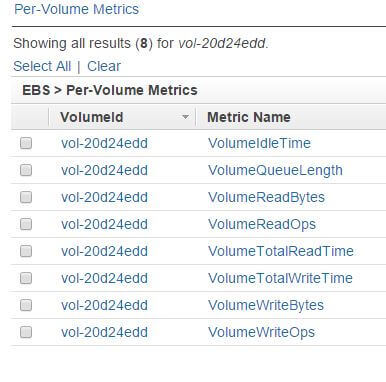
The images below show some of the CloudWatch performance metrics for EC2 instances and EBS volumes. Selecting any of the links would open up a window showing that metric’s graph. Looking at these metrics, we can see they provide some good indication of the overall system health. For example, the CPUUtilization graph tells us if a particular node is under CPU pressure. By default, there are no memory utilization metrics for EC2 instances, but it’s possible to get this data with some extra tweaking. CloudWatch metrics are updated every five minutes by default, but with an extra cost they can be configured to update every one minute. CloudWatch data is available for a rolling period of two weeks.
Now, these out-of-box metrics are great, but they don’t give us the full picture. We can’t for instance, know if the SQL Server data cache in memory is being utilized optimally. What we need here is something deeper.
Windows Performance Counter Data Collector Sets
We can of course log into a SQL Server box and run a Windows Performance Counters Data Collector Set locally. In the image below, we have configured one such Collector Set with a number of counters listed. We can run this Data Collector Set to record the data in the server.

However, there are certain limitations with this approach:
- We can’t keep a PerfMon Data Collector Set running indefinitely. The collected data will eventually fill up disk space.
- Every time we need to access the performance data, we have to remotely log into the server. If someone else needs to access the data, they have to be assigned RDP permissions as well. We can perhaps run custom code to export and copy the data locally, but that will mean writing and testing our own program.
- We can’t create custom dashboards to show only some of the data collected. Graphs can be overlaid in PerfMon, but with more than three graphs overlaid, it quickly becomes unmanageable and difficult to understand.
- We can’t create alerts if a counter value crosses some threshold.
AWS CloudWatch Metrics Exposing Windows Performance Counter Values
One of the great features of AWS CloudWatch is its ability to publish performance metrics from the underlying operating system. AWS CloudWatch can now store and display Performance Monitor counters from Windows EC2 instances. This means we don’t have to worry about disk space, we don’t have to worry about remote server access. We can pick and choose whatever counters we want published to CloudWatch and create dashboards for those counters. We can also create alerts on those metrics.
Making it work is surprisingly simple and in the next two parts of this series we will see how it’s done.
The DevOp DBA
But before going any further, we will assume a few things about you.
We will assume:
- You have some (at least basic) experience in cloud platforms, particularly Amazon Web Service (AWS). You are familiar with AWS services like EC2, CloudWatch etc.
- You have good understanding of Microsoft SQL Server and familiar with the performance counters it exposes through Windows.
- You have basic Windows Server 2008 R2 or 2012 skills and have RDP access to the SQL Server you will manage.
- You are quite familiar with Windows Performance Counter Data Collector Sets and know how to create one.
You can see the assumptions here are not for someone who has never worked in a cloud-based setup. As the world of IT advances with break-neck speed, DBAs have to keep reinventing themselves. They need to learn more about the new trends and technologies shaping the industry and understand how those new technologies fit with their daily work. Examples of these new areas include cloud, automated infrastructure provisioning (infrastructure-as-code), database version control, configuration management tools, DevOps principles, agile methodologies, etc.
We can call this new breed of DBAs DevOps-DBAs. They are not old school DBAs, and they are certainly not traditional Windows/VMWare engineers. They have a fusion of new skills. They can seamlessly work with developers and infrastructure engineers, but they also have superior database administration skills.
In the coming months we plan to publish a series of articles on MSSQLTips.com targeted at such DevOps-DBAs. This is the first topic in our line-up and we want you to get maximum benefit from it. That’s why we have listed our assumptions above.
Conclusion
We have just started our journey into a new way of looking at SQL Server performance monitoring. In the next installments we will build upon core concepts and then make a performance monitor dashboard.
Next Steps
- Learn more about Windows Performance Counter Data Collectors.
- Determine what level of performance monitoring you need for your SQL Servers and see if they can be measured with Windows Performance Monitor.
- Learn more about AWS CloudWatch. If you already have an AWS account or have access to an account, find out what metrics are available for various services and what’s being measured.

Sadequl Hussain lives in Sydney, Australia and holds a Bachelor’s degree in Electrical Engineering. His more than 15 years’ experience in IT has seen him in various roles including training, technical writing, web application development and database administration. Sadequl has been working with SQL Server since version 6.5 and his life as a DBA has seen him managing mission critical database systems for various large companies. He is also an Oracle DBA and an avid Linux administrator. Over the years Sadequl has achieved various certifications including those from Microsoft, CompTIA and ITIL. He is currently having fun preparing for other ones from Amazon and the Open Group. He regularly contributes to various SQL Server and Linux online publications. Apart from spending time with his wife and daughter, he loves his part-time career as a photographer and film-maker and also loves to travel.
- MSSQLTips Awards: Trendsetter (25+ tips) – 2017


Any chance you can post all the metrics added to the data collector set in this example?