Problem
This is the third and final part of an ongoing series about integrating Windows performance counters with AWS CloudWatch. In the second part of the series, we were introduced to the EC2Config service and its configuration file. We will start by making changes to that file.
Solution
If you already haven’t opened the AWS.EC2.Windows.CloudWatch.json file, open it in a text editor. By default, it’s located under the directory %SystemRoot%\Program Files\Amazon\Ec2ConfigService\Settings. If you want a refresher on what this file represents, feel free to refer to the second part of this series where we explained different parts of the file and how they are arranged.
Next, modify the file so it looks like this:
{
"EngineConfiguration": {
"PollInterval": "00:00:15",
"Components": [
{
"Id": "AvailableMBytes",
"FullName": "AWS.EC2.Windows.CloudWatch.PerformanceCounterComponent.PerformanceCounterInputComponent,AWS.EC2.Windows.CloudWatch",
"Parameters": {
"CategoryName": "Memory",
"CounterName": "Available MBytes",
"InstanceName": "",
"MetricName": "Available MBytes",
"Unit": "Megabytes",
"DimensionName": "",
"DimensionValue": ""
}
},
{
"Id": "PageFaultsPerSecond",
"FullName": "AWS.EC2.Windows.CloudWatch.PerformanceCounterComponent.PerformanceCounterInputComponent,AWS.EC2.Windows.CloudWatch",
"Parameters": {
"CategoryName": "Memory",
"CounterName": "Page Faults/sec",
"InstanceName": "",
"MetricName": "Page Faults/sec",
"Unit": "Count",
"DimensionName": "",
"DimensionValue": ""
}
},
{
"Id": "PagesPerSecond",
"FullName": "AWS.EC2.Windows.CloudWatch.PerformanceCounterComponent.PerformanceCounterInputComponent,AWS.EC2.Windows.CloudWatch",
"Parameters": {
"CategoryName": "Memory",
"CounterName": "Pages/sec",
"InstanceName": "",
"MetricName": "Pages/sec",
"Unit": "Count",
"DimensionName": "",
"DimensionValue": ""
}
},
{
"Id": "BufferCacheHitRatio",
"FullName": "AWS.EC2.Windows.CloudWatch.PerformanceCounterComponent.PerformanceCounterInputComponent,AWS.EC2.Windows.CloudWatch",
"Parameters": {
"CategoryName": "SQLServer:Buffer Manager",
"CounterName": "Buffer cache hit ratio",
"InstanceName": "",
"MetricName": "SQL Server Buffer Cache Hit Ratio",
"Unit": "Percent",
"DimensionName": "",
"DimensionValue": ""
}
},
{
"Id": "DatabaseCacheMemory",
"FullName": "AWS.EC2.Windows.CloudWatch.PerformanceCounterComponent.PerformanceCounterInputComponent,AWS.EC2.Windows.CloudWatch",
"Parameters": {
"CategoryName": "SQLServer:Memory Manager",
"CounterName": "Database Cache Memory (KB)",
"InstanceName": "",
"MetricName": "SQL Server Database Cache Memory",
"Unit": "Kilobytes",
"DimensionName": "",
"DimensionValue": ""
}
},
{
"Id": "PageLifeExpectancy",
"FullName": "AWS.EC2.Windows.CloudWatch.PerformanceCounterComponent.PerformanceCounterInputComponent,AWS.EC2.Windows.CloudWatch",
"Parameters": {
"CategoryName": "SQLServer:Buffer Manager",
"CounterName": "Page life expectancy",
"InstanceName": "",
"MetricName": "SQL Server Page Life Expectancy",
"Unit": "Count",
"DimensionName": "",
"DimensionValue": ""
}
},
{
"Id": "MemoryGrantsOutstanding",
"FullName": "AWS.EC2.Windows.CloudWatch.PerformanceCounterComponent.PerformanceCounterInputComponent,AWS.EC2.Windows.CloudWatch",
"Parameters": {
"CategoryName": "SQLServer:Memory Manager",
"CounterName": "Memory Grants Outstanding",
"InstanceName": "",
"MetricName": "SQL Server Memory Grants Outstanding",
"Unit": "Count",
"DimensionName": "",
"DimensionValue": ""
}
},
{
"Id": "MemoryGrantsPending",
"FullName": "AWS.EC2.Windows.CloudWatch.PerformanceCounterComponent.PerformanceCounterInputComponent,AWS.EC2.Windows.CloudWatch",
"Parameters": {
"CategoryName": "SQLServer:Memory Manager",
"CounterName": "Memory Grants Pending",
"InstanceName": "",
"MetricName": "SQL Server Memory Grants Pending",
"Unit": "Count",
"DimensionName": "",
"DimensionValue": ""
}
},
{
"Id": "TotalServerMemory",
"FullName": "AWS.EC2.Windows.CloudWatch.PerformanceCounterComponent.PerformanceCounterInputComponent,AWS.EC2.Windows.CloudWatch",
"Parameters": {
"CategoryName": "SQLServer:Memory Manager",
"CounterName": "Total Server Memory (KB)",
"InstanceName": "",
"MetricName": "SQL Server Total Server Memory",
"Unit": "Kilobytes",
"DimensionName": "",
"DimensionValue": ""
}
},
{
"Id": "TargetServerMemory",
"FullName": "AWS.EC2.Windows.CloudWatch.PerformanceCounterComponent.PerformanceCounterInputComponent,AWS.EC2.Windows.CloudWatch",
"Parameters": {
"CategoryName": "SQLServer:Memory Manager",
"CounterName": "Target Server Memory (KB)",
"InstanceName": "",
"MetricName": "SQL Server Target Server Memory",
"Unit": "Kilobytes",
"DimensionName": "",
"DimensionValue": ""
}
},
{
"Id": "CloudWatch",
"FullName": "AWS.EC2.Windows.CloudWatch.CloudWatch.CloudWatchOutputComponent,AWS.EC2.Windows.CloudWatch",
"Parameters":
{
"AccessKey": "",
"SecretKey": "",
"Region": "",
"NameSpace": "EC2-SQLServer"
}
}
],
"Flows": {
"Flows":
[
"(AvailableMBytes,PageFaultsPerSecond,PagesPerSecond,BufferCacheHitRatio,DatabaseCacheMemory,PageLifeExpectancy,MemoryGrantsOutstanding,MemoryGrantsPending,TotalServerMemory,TargetServerMemory),CloudWatch"
]
}
}
}
So what are we doing here? We know this configuration file is written in JSON, and it controls how the EC2Config service would interface with AWS CloudWatch, but how does it do it? To understand, let’s go through the file, starting from the top:
- We have kept the polling interval to its original value of 15 seconds.
- We have deleted the existing components for different Windows logs and CloudWatch logs.
- We have added a number of components related to Windows performance counters.
- Each component is defined in a separate section in JSON format.
- Each component has a unique ID. The IDs can have any value as long as it’s unique within the document. We have used IDs that represent individual performance counters.
- We can leave the “FullName” key with its default value.
- All the components relate to operating system and SQL Server memory counters.
- “CategoryName” should be exactly the same as the performance counter it represents. Same goes for the “CounterName” key. For example, if we want to capture a Windows performance counter called “SQLServer:Buffer Manager\Buffer cache hit ratio”, the “CategoryName” key value must be “SQLServer:Buffer Manager” and the “CounterName” key must be “Buffer cache hit ratio”.
- The “InstanceName” key is not necessary here so we have left it blank. However, it will be required for other types of counters For example, if we were sending Avg. Disk Queue Length of the C:\ drive, the InstanceName would be “C”.
- We can provide any value for the “MetricName” key. This is the name CloudWatch will use for the performance counter.
- “Unit” can be different for different counters. Some are defined in Megabytes, some in Kilobytes, some in percent etc. For a detailed list of unit types, refer to AWS documentation.
- We have left the “DimensionName” and “DimensionValue” keys blank. These parameters mainly control the display behavior of the CloudWatch metrics.
- The final component with ID “CloudWatch” defines how EC2Config will access the CloudWatch service.
- We are using the Access Key ID and Secret Access Key of the IAM user we created in part 2 of this series. Remember that we had to create the account because we assumed the EC2 instance was not created with an IAM role.
- “Region” key is the name of AWS region where we want to publish the counters in CloudWatch.
- “NameSpace” key can have any value, however, it’s best to give it a meaningful name. AWS CloudWatch groups all the counters coming from a specific instance under a namespace. In our example, we are calling the namespace as “EC2-SQLServer”.
- Finally, the “Flows” section shows which components are actually sent to CloudWatch. The way we are doing this is by grouping the IDs of various PerfMon counter components within parentheses and following that with the CloudWatch component’s ID, both separated by a comma.
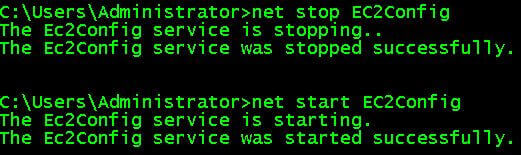
Once the change is complete and the file is saved, the EC2Config service needs to be restarted.
CloudWatch Custom Metrics
Now let’s open the AWS CloudWatch console in a browser window and click on the “Metrics” link from the navigation pane.

This opens up the “CloudWatch Metrics by Category” screen. Selecting the drop down list under “Custom Metrics” section shows us the namespace created before (in our example, this is “EC2-SQLServer”).

If we select the namespace, a new screen will come up with a list of new CloudWatch metrics as shown below. If we look closely, we will see these are the metric names we defined in the configuration file before. Looking at the metrics also tells us they represent memory related performance counters.

Selecting any of the metrics will show the corresponding graph in the bottom half of the screen. It will take some time for the graphs to build up though as EC2Config would have only started to stream the counters to CloudWatch.
Creating the Dashboard
Viewing individual metrics is fine, but we want to group all the custom metrics together. Ideally, we would like a dashboard where all the customized metrics we created will be shown with their individual graphs. Looking at the dashboard should give us an overall picture of the memory usage trend.
To do that, we need to select the “Dashboards” link in the CloudWatch console’s navigation pane. This opens the CloudWatch Dashboards console. From here, we can create one or more dashboards.

Clicking on the “Create dashboard” button will prompt us for a new dashboard name. We have provided a meaningful name here:

Clicking on the “Create dashboard” button in the dialog box will create an empty dashboard for us. When created for the first time, this will also open another small dialog box asking if we want to add a metric graph or a text widget to our dashboard. By default, the metric graph option is chosen, and we can click “Configure”.

The screen that appears next will again show the “CloudWatch Metrics by Category” screen. We have to choose the namespace for our custom metrics.

In the next screen, we will again see the custom memory metrics we created before. We can select any of those metrics and click on the “Create widget” button. This will add the metric graph to the dashboard.
Unfortunately, selecting multiple metrics at the same time will make the graphs overlap on each other, something we want to avoid, so we have to keep repeating the process until all the metric graph widgets are added to the dashboard. It’s an inconvenience no doubt, particularly if you have a large number of custom metrics to add to a dashboard, but we could not find any other simple way to do this.
Also, if we want to add more metrics graphs later, we can choose the “Add metric graph” option from the Actions menu or click on the “Add widget” button.

Once the process is complete, we will have an AWS CloudWatch dashboard displaying a series of Windows and SQL Server memory counters from our EC2 instance.

If we click on any of the graphs, it will come up in a separate dialog box. By default, we can go back 14 days for any CloudWatch metric. To change the display interval (minutes, hours or days), we can choose the appropriate scale from the time range menu located at top right corner:

From the same drop down list, we can choose the time zone (default is UTC) or the granularity of the values displayed (default is 5 minutes).
The other menu at top right corner shows us how often the dashboard is refreshed. We have left it to auto refresh.

Final Words
Now that we have an AWS CloudWatch dashboard for our SQL Server instance, we can go ahead and create custom metrics for other PerfMon counters like Avg. Disk Queue Length, SQL Errors etc. We can create a series of dashboards for different types of counters.
Another thing we can do is define alerts on the custom metrics. For example, we might want to get notified when the Buffer Cache Hit Ratio is consistently below 90% for 15 minutes. For that, we can define a CloudWatch Alarm on this particular metric. When the alarm is triggered, it can send a notification to an AWS Simple Notification Service (SNS) topic, which in turn can send the message to an e-mail address or a mobile device. We won’t go into the details of creating SNS topics or creating CloudWatch alarms here, but the image below shows how we can do this.

We should also consider how we want this dashboard to be available. Ideally, this type of dashboard should be used by SysOps, DBAs, infrastructure engineers or architects. Needless to say, your organization should have strict policies about who can access the AWS console. Again, creating IAM users, group and assigning minimal permissions to view the dashboard can address some of the security concerns.
Next Steps
- Learn how to create AWS CloudWatch Alarm and how it can interface with AWS Simple Notification Service.
- Create a number of custom metrics in CloudWatch and create dashboards from those metrics. You can also add built-in metrics to the dashboard. Experiment until you find the right number of metrics for your business need.
- Check out the previous tips in this series:

Sadequl Hussain lives in Sydney, Australia and holds a Bachelor’s degree in Electrical Engineering. His more than 15 years’ experience in IT has seen him in various roles including training, technical writing, web application development and database administration. Sadequl has been working with SQL Server since version 6.5 and his life as a DBA has seen him managing mission critical database systems for various large companies. He is also an Oracle DBA and an avid Linux administrator. Over the years Sadequl has achieved various certifications including those from Microsoft, CompTIA and ITIL. He is currently having fun preparing for other ones from Amazon and the Open Group. He regularly contributes to various SQL Server and Linux online publications. Apart from spending time with his wife and daughter, he loves his part-time career as a photographer and film-maker and also loves to travel.
- MSSQLTips Awards: Trendsetter (25+ tips) – 2017


Is this still valid in 2021?