By: Fikrat Azizov | Comments (3) | Related: > Performance Tuning
Problem
The SQL Server query cache contains valuable performance statistics and execution plans of recently executed query workloads that can be useful to tuning your server. Many DBA's use this information on a daily basis for performance analysis and optimization. While this information is easily obtained using DMV's, a thing to note is that it gets wiped out on each SQL Server restart or partially lost when the server is under memory pressure.
Another problem is that execution plans are in XML format. That means some diagnostic queries which require content analysis of execution plans may need shredding of multiple XML files which could be quite resource intensive and sometimes not desirable to be run on production servers. So, it would be very useful to collect and analyze this information on a centralized non-production server where we could create XML indexes to facilitate more efficient XML parsing.
Once collected on a central server, we could create various reports to show top 'N' underperforming queries, average executions stats, historical trends, etc. What's more important is that this would allow us to analyze performance data at the enterprise level.
Although SQL Server 2016 has introduced the Query Store feature which allows this kind of collection and analysis, in this tip I'll show how to build a simple centralized query store with earlier versions of SQL Server.
Solution
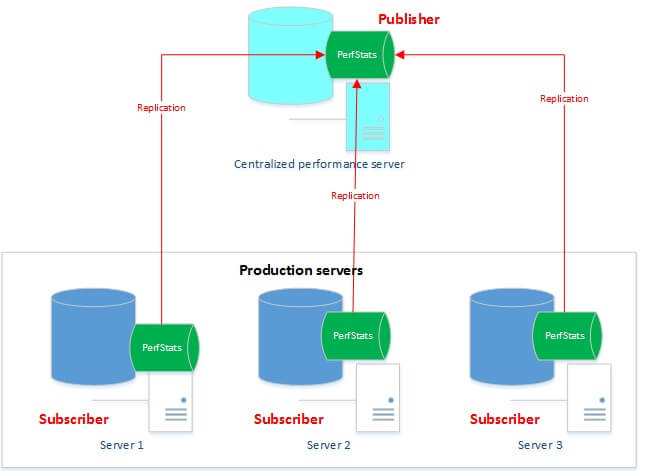
The idea is to collect data from each server and bring the data back to a centralized server for data analysis. The approach I took to centralize the data was to use SQL Server merge replication and here is high level overview.
As you can see from the image below, each production server hosts a PerfStats database where performance statistics are being collected on a regular basis and then data from each PerfStats database is replicated to a centralized PerfStats database located on a non-production server. Each server contains only data specific to it, while the central server contains data from all servers.

Data collected by this solution could be used for the following purposes and more:
- Generating reports for top 'N' underperforming queries across all servers with their max/min and average execution statistics.
- Identifying historical performance trends for queries, as well as possible parameter sniffing issues.
- Identifying best query candidates for optimization, based on their execution stats and execution plans.
- Identifying statistics used in execution plans.
- Identifying best table/index candidates for a columnstore index upgrade.
The solution described here captures query statistics, execution plans and wait statistics, however it could also be adjusted to collect other useful performance data, like deadlocks, blocks, index fragmentation, statistics, etc.
Database Structure
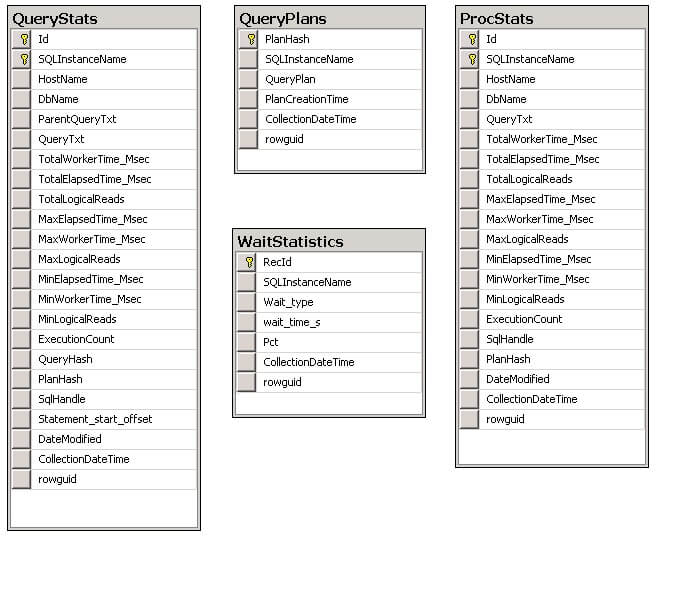
The PerfStats database contains the following tables and views:
- QueryPlans - This table contains execution plans in XML format.
- QueryStats - This table contains query statistics like, min/max elapsed time, logical reads and execution count. It's related to the QueryPlans table on the PlanHash field.
- ProcStats - This table is like QueryStats, except it contains procedure level statistics. It's related to the QueryPlans table on PlanHash field.
- WaitStats - This table contains wait statistics.
- vProcStats_Plans - This view joins tables ProcStats and QueryPlans to produce procedure statistics combined with execution plans.
- vQueryStats_Plans - This view joins tables QueryStats and QueryPlans to produce query statistics combined with execution plans.

Code Description
The below stored procedures are designed to obtain and store performance statistics from the cache:
- CollectQueryStats
- This procedure collects query and procedure
statistics. Here is the description the parameters:
- @vTopNRows - allows to specify only top N queries to be collected on each run. This parameter requires @vOrderBy -parameter to be specified.
- @vDbList - optional string parameter to include specified databases, names should be comma separated. When this parameter's value is NULL, the procedure will collect all queries from the cache, regardless of the database.
- @vOrderBy - string parameter to specify order in which queries
would be selected. By default it's ordered by TotalElapsedTime_Msec,
but this could be changed to any field from the below list:
- TotalWorkerTime_MSec
- TotalElapsedTime_MSec
- Total_logical_reads
- MaxElapsedTime_MSec
- MaxWorkerTime_MSec
- Max_logical_reads
- MinElapsedTime_MSec
- MinWorkerTime_MSec
- Min_logical_reads
- Execution_count
- @vFilterStr -string parameter to limit collection
by certain fields. For example, if you want to collect only queries
exceeding 10 seconds you could specify @FilterStr='MinElapsedTime_Msec>10000'. List
of field names you can use include:
- total_worker_time
- total_elapsed_time
- total_logical_reads
- max_elapsed_time
- max_worker_time
- max_logical_reads
- min_elapsed_time
- min_worker_time
- min_logical_reads
- execution_count
- @vCollectStatsInfo - this is a bit parameter which enables/disables trace flag 8666 allowing you to include table statistic information as part of execution plan. This information could be used for table statistics analysis, as well as for parameter sniffing investigation and could shed light on why SQL has created this particular execution plan. Please note this flag is not documented and does not work well on versions below SQL 2012. You can find more information about this flag in this article by Fabiano Neves Amorim.
- This procedure collects query and procedure
statistics. Here is the description the parameters:
- GetWaitStats
- This procedure collects wait statistics,
which could be used for server level wait analysis. Below is the description
of the parameters:
- @TopN - allows to specify only top N waits (in terms of relative percentage) to be collected.
- @MinPct - allows to specify minimum percentage of wait time to be included in the collection.
- This procedure collects wait statistics,
which could be used for server level wait analysis. Below is the description
of the parameters:
- CollectPerfStats
- This is a shell procedure which
calls the above listed stored procedures. As you can see below, most of the parameters resemble
the CollectQueryStats parameters:
- @DbList -optional string parameter to include only specified databases, names should be comma separated
- @GetQueryStats - bit parameter to enable/disable query execution stats collection
- @TopN - allows to specify only top N queries to be collected on each run
- @OrderBy - string parameter to specify order in which queries would be selected
- @FilterStr - string parameter to limit collection by certain fields
- @CollectStatsInfo - bit parameter, which enables/disables trace flag 8666
- @GetWaitStats - bit parameter which enables/disables wait stats
- @GetIndexRowCnt - bit parameter which enables/disables row count stats
- This is a shell procedure which
calls the above listed stored procedures. As you can see below, most of the parameters resemble
the CollectQueryStats parameters:
- PurgePerfData
- This procedure purges stats data and has a single parameter (@MaxDays) specifying number of days to be kept.
Solution Deployment
You can download the deployment scripts here.
Below is the description of the included scripts:
- CreatePerfStatsDB.sql - this script creates a PerfStats database and the database objects. Please set the appropriate database compatibility level (currently set to 100 -SQL 2008) and folder location for the database files.
- CreatePerfStatsCollectionJobs.sql - this script creates a job named CollectQueryPerfStats to collect performance stats. This job has a single step to call CollectPerfStats procedure. Please note the appropriate @DbList parameter needs to be supplied to this script prior to its execution. Currently the CollectQueryPerfStats job is scheduled to run every midnight, however its frequency and timing could easily be changed.
Replication Architecture and Configuration
As mentioned above, the data exchange between the production server and central server could be done using SQL Server merge replication, where the central server acts as the publisher and the production servers are subscribers. Data would be collected at the subscribers and replicated to the publisher on a regular basis. Each server would contain data specific to it while the publisher would contain all data. To achieve this, I've configured filtered replication based on the SQLInstanceName field which is part of each table.
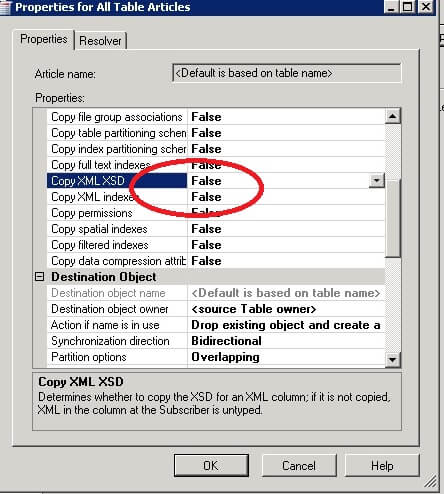
In order to create a publication on the central server, you can use the script CreateMergePublication_PerfStats.sql from the deployment zip file. I've included only tables in this publication, however other database objects could be included if required. As a replication filter, I've used this condition [SQLInstanceName] =@@SERVERNAME for each table. To minimize overhead on the production servers, replication distribution jobs are configured on the publisher. I've also excluded XML indexes from being replicated in the replication configuration as you can see in the below screenshot.

Once the publication is created, you can follow the below steps to create a subscription for each production server:
- Create PerfStats database using the script CreatePerfStatsDB.sql on each subscriber
- Open the script CreateSubscription.sql on publisher, replace the 'IntanceName' keyword with the name of subscriber instance name and execute to create the subscriber.
- These scripts will create a publication snapshot job and number of subscription synchronization jobs on the central server. Snapshot job needs to be run only once, as a first step, followed by execution of the subscription jobs. Subscription jobs are currently set to run at 1:00 AM (every day), the frequency and timing could be changed.
Performance Considerations
Performance overhead of this solution on production servers is negligible and limited to the following factors:
- Replication - As mentioned above, each subscriber contains only its own data, which minimizes data flow between servers. Although replication impact on subscribers is expected to be very low, the preferred time for synchronization is during non-business hours.
- Collection jobs - I've created some indexes to improve performance
for some queries and views. The deployment scripts also create some XML indexes
in a disabled state. These indexes could improve performance
of XPATH queries and reports on the central server and I'll describe
them in one of the future tips related to application of this
solution. Please note that enabling the XML indexes on the central server
would not cause them to be enabled on the production servers
(subscribers), due to the way replication is configured. This job is fast and
on my test environment it finishes in less than 2 minutes, however its duration
depends on input parameters supplied in the included query and could
probably further
tuned if needed.
Next Steps
- Download all of the scripts for this solution
- Read more about merge replication in this article
- Read more about the SQL 2016 Query Store feature in this article
About the author
 Fikrat Azizov has been working with SQL Server since 2002 and has earned two MCSE certifications. He’s currently working as a Solutions Architect at Slalom Canada.
This author pledges the content of this article is based on professional experience and not AI generated.
View all my tips


