By: Daniel Farina | Comments | Related: > Performance Tuning
Problem
You are a SQL Server Database Administrator and you are experiencing problems in one of your instances. After hours of searching on the web and consulting some colleagues, you realize you are not sure what to do so you contact the Microsoft Support Team and tell them about your situation. The Microsoft Support Engineer asks if you can send him a process dump of SQL Server. Since this is not a task we DBAs do quite often you are not sure how to do this. In this tip I will show you how to create a process dump of SQL Server using the SqlDumper.exe tool.
Solution
Most SQL Server DBAs never face a situation like this, but we should know how to deal with it. Something I want make clear is that this tip is not intended to be a full guide on using SqlDumper.exe tool. I will just cover the very basics that will allow you to take a SQL Server process dump.
What is a Process Dump?
A process dump is the snapshot of a process for a given point of time. Imagine that you have a process running on your system like the SQL Server service process. Basically a snapshot consists of copying all of the process data that is in RAM and virtual memory to a file on the hard disk. This allows a professional technician with advanced knowledge in debugging, to recreate the scenario on which the process was executing at the instant when the process dump was taken.
Independently of whatever the process is, its execution is always dynamic. I mean even if you consider the Windows Notepad application running in the background and you take two process dumps of it separated by seconds you will get a different result.
The reason behind this is that on Windows and Linux operating systems, processes run in shared time, so even when the process seems inactive it is still processing in a message loop where the messages are sent by the operating system.
Considerations before Taking a SQL Server Process Dump
The creation of a process dump of SQL Server is not something to be taken lightly. In the previous paragraphs I told you that a process dump is the snapshot of a given process. Please allow the following analogy: What do you ask for when you take a snapshot of your family or friends? You ask them to stand still. Well the same situation happens when you intend to take a snapshot of the SQL Server process. In order to make the snapshot consistent, the snapshot process makes the SQL Server idle (to stand still in the previous analogy) while the snapshot is taken.
The consequence is that by taking a process dump it can create an execution requests queue or even produce a fail over event on clustered and Always On instances, but that is beyond the scope of this tip.
Taking SQL Server Process Dumps Using sqldumper
There are many different ways to take a process dump either of SQL Server or another application. But Microsoft includes an application in the SQL Server installations named SqlDumper.exe that gives us some extra functionality over the other methods to take a dump as you will see further on. This tool is located on the folder where SQL Server was installed, typically C:\Program Files\Microsoft SQL Server\140\Shared. Notice that the subfolder 140 corresponds to the version number of SQL Server installed in your system. In the next table I enumerate the versions starting from 2008 to 2017 and its version number.
| SQL Server Version | Version Number |
|---|---|
| SQL Server 2017 | 140 |
| SQL Server 2016 | 130 |
| SQL Server 2014 | 120 |
| SQL Server 2012 | 110 |
| SQL Server 2008 R2 | 105 |
| SQL Server 2008 | 100 |
The SqlDumper.exe Tool
The sqldumper application offers us the advantage to taking different types of process dumps over other process dumping utilities. In the next list I enumerate the types of dumps allowed:
- Mini dumps: These types of dumps are the ones that require less disk space. Basically this type of dump only stores the thread stack of the SQL Server process. Additionally you can include indirectly referenced memory.
- Full dumps: If you have enough disk space, you can take a full process dump which is basically a copy of all the contents of the process memory. This also includes the process virtual memory.
- Filtered dumps: This type of dump was implemented due to the large amount of memory SQL Server instances have nowadays, which makes it impractical to take a full dump. Basically it filters out the areas of process memory that contain data and index pages. This type of dump is recommended over the full dump because most of the time what you need to debug a SQL Server process dump is what you want to see is the instructions being executed.
In order to create any of these types of dumps, you have to pass to the SqlDumper.exe utility a flag matching the proper dump type. Following is a table with the flags list and its matching dump type.
| Dump Type | Flag |
|---|---|
| Mini Dump | 0x0120 |
| Mini Dump with indirectly referenced memory | 0x0128 |
| Full Dump | 0x01100 |
| Filtered Dump | 0x8100 |
Taking SQL Server Process Dumps Using SqlDumper.exe
The very first step to take a SQL Server process dump is to use the right Windows user account. You will need an account with rights to read other process address space. This prerequisite is fulfilled by any account with administrative rights. Then you have to open a command window and run SqlDumper.exe with the appropriate parameters.
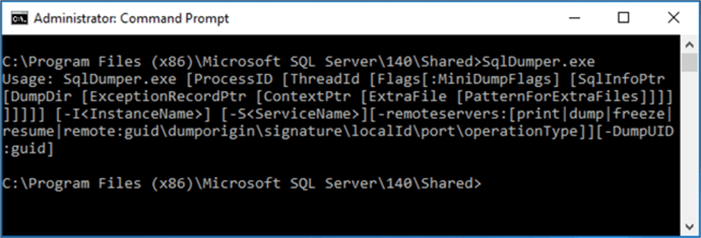
On the next screen capture you will see the results of executing SqlDumper.exe without any parameters, which is the way to get the basic info on how to execute it.

I wrote the output into the next code segment in order to ease your visualization.
SqlDumper.exe [ProcessID [ThreadId [Flags[:MiniDumpFlags] [SqlInfoPtr [DumpDir [ExceptionRecordPtr [ContextPtr [ExtraFile] [PatternForExtraFiles]]]]]]]]
[-I<InstanceName>]
[-S<ServiceName>]
[-remoteservers:[print|dump|freeze|resume|remote:guid\dumporigin\signature\localId\port\operationType]]
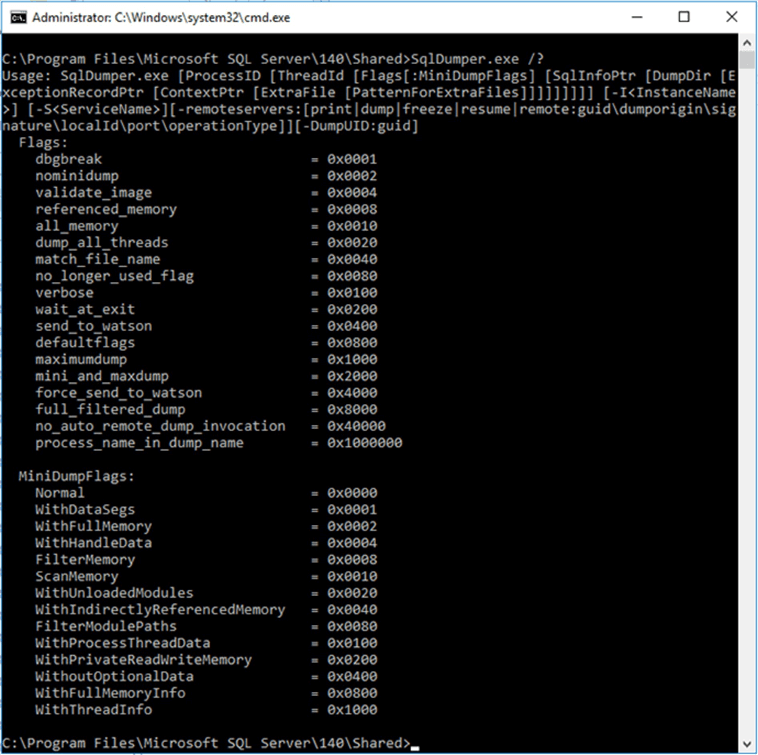
Additionally, you can run SqlDumper.exe using the /? switch and get a more complete user guide.
SqlDumper.exe /?
If you take a look at the following screen capture you will see the results of the previous command execution.

As you can see, the extra help doesn't seem to be enough. The only addition is some flags with the name, but not a description or a usage guide. Unfortunately, Microsoft doesn't put much effort into documenting this tool.
But don't worry, if our intentions are to take a dump with not too much sophistication to send to a Microsoft Support Engineer, we can do so using the following syntax.
SqlDumper.exe [ProcessID [ThreadId] [Dump Type Flags] [SqlInfoPtr] [Dump Directory]
Here is a table with a description of the arguments:
| Argument | Description |
|---|---|
| ProcessID | The SQL Server process identifier you want to take a dump. |
| ThreadId | The thread of the SQL Server process specified with ProcessID you want to dump. For the main thread you must use 0. |
| Dump Type Flags | The dump type (MiniDump, Mini Dump with indirectly referenced memory, Full Dump or Filtered Dump). |
| SqlInfoPtr | This is for internal use. For the purposes of this tip we will set it to zero. |
| Dump Directory | This is the folder you want to use as the destination for the dump file. |
Example
In order to get the SQL Server process id, you can look at SQL Server Configuration Manager as it's shown on the next screen capture.

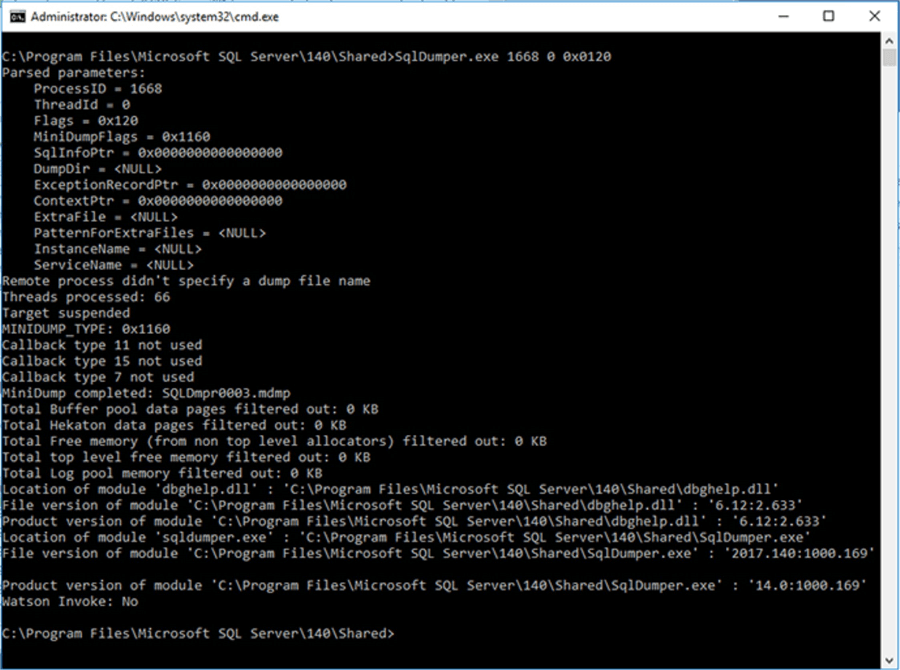
The previous screen capture shows that my SQL Server process id is 1668. Let's take a mini dump of it by passing 1668 as the process id, zero as the thread id so we refer to the main thread and 0x0120 as the flag for a mini dump to SqlDumper.exe.
SqlDumper.exe 1668 0 0x0120
On the next screen capture you can see the results of the previous command execution.

Notice that I have not included [SqlInfoPtr] [Dump Directory] parameters in the command invocation. Those parameters are not mandatory. But if you want to use [Dump Directory] to store the dumped process data in another location you will also need to include [SqlInfoPtr] with the value 0 as I told you. This is because SqlDumper.exe handles parameters according its order in the command invocation.
For example, the next command execution will create the same dump we made before, but instead of storing it in the local folder, this will store it in the C:\Dumps folders.
SqlDumper.exe 1668 0 0x0120 0 C:\Dumps
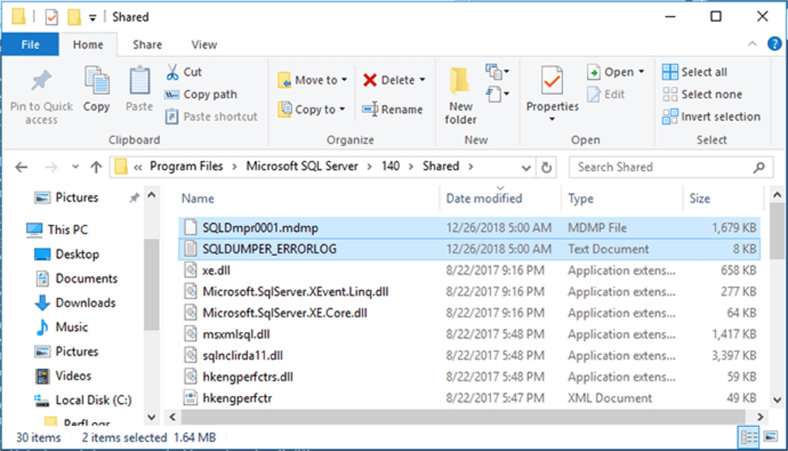
After creating an SQL Server process dump with SqlDumper.exe you will find two files in the current folder or the folder you have specified as the destination for the process dump:
- SQLDUMPER_ERRORLOG.txt: This file logs each execution of SqlDumper.exe. If the file already exists, the execution results are appended.
- SQLDmpr0001.mdmp: It contains the dumped SQL Server process data. The ending number could vary in case you have another SQL Server process dump in the current folder.
On the next image you can see a screen capture showing those files in the SqlDumper.exe folder.

Next Steps
- If apart from sending your process dump to Microsoft support you also want to open and try to debug it yourself you must have WinDbg which you can download on the next link: Download Debugging Tools for Windows.
- On the next link you will find lots of information regarding WinDbg usage http://www.windbg.org/. Neither I nor MSSQLTips.com has any affiliation with this site.
- Stay tuned to SQL Server Debugging Tips Category for more tips.
- For more SQL Server administration tips take a look at the SQL Server Database Administration Tips Category.
About the author
 Daniel Farina was born in Buenos Aires, Argentina. Self-educated, since childhood he showed a passion for learning.
This author pledges the content of this article is based on professional experience and not AI generated.
View all my tips


