By: Ben Snaidero | Comments (2) | Related: > Performance Tuning
Problem
I am updating my SQL Server table statistics nightly, but I am still seeing occasional poor performance with some of the queries being executed against my database. Could statistics still be the issue?
Solution
If you're like most DBA's (I'll include myself in this category) you leave the default database settings alone and have "Auto Create Statistics" and "Auto Update Statistics" enabled on your databases. With these settings enabled you get estimated statistics created/updated on your tables, indexes and columns and in most cases these estimated statistics are good enough to provide the optimizer with enough data to come up with a good explain plan. In some cases though, depending on your data, these estimated statistics might not be accurate enough to allow the optimizer to come up with the optimal or even a good execution plan. Let's take a look at a simple example to demonstrate this point.
SQL Server Objects
-- Table creation logic
CREATE TABLE testtable ([col1] [int] NOT NULL,
                        [col2] [int] NOT NULL,
                        [col3] [int] NOT NULL,
                        [col4] uniqueidentifier NOT NULL);

ALTER TABLE testtable ADD CONSTRAINT PK_testtable PRIMARY KEY NONCLUSTERED (col4);

CREATE NONCLUSTERED INDEX IX_testtable ON dbo.testtable (col1,col2,col3);

-- Populate table
DECLARE @x INT, @y int
SELECT @x=1
WHILE @x <= 1000
BEGIN
   SELECT @y=1
   WHILE @y <= 10000
   BEGIN
       INSERT INTO testtable (col1, col2, col3, col4)
       VALUES (@x*2,@y,@y+@x,newid())
       SELECT @y=@y+1
   END
   SELECT @x=@x+1
END
GO

DELETE FROM testtable WHERE col1 in (6,10,12,102,110,116,400,280,1100,1102,1110,1152,1500,1755,1950)
GO

DELETE FROM testtable WHERE col1 between 1300 and 1400
GO

CREATE TABLE test (col1 int NOT NULL);

ALTER TABLE test ADD CONSTRAINT PK_test PRIMARY KEY NONCLUSTERED (col1);

INSERT INTO test SELECT DISTINCT col1 FROM testtable;
SQL Server Table Statistics Example
If you look at the script above you can see that for each value in testtable.col1 we have 10000 rows. Let's run the UPDATE STATISTICS command and use the sample option to gather some estimated statistics on this table. Below is a query you can run to gather these statistics. I chose 100000 rows as the sample size since I have seen some large tables (over 10 billion rows) use as little as 0.04% of the table data to estimate the column statistics.
UPDATE STATISTICS testtable IX_testtable WITH SAMPLE 100000 ROWS;
Once that completes we can use the DBCC SHOW_STATISTICS as shown below to get a look at the index details.
DBCC SHOW_STATISTICS ('testtable','IX_testtable');
And here is the output of the above command. For the sake of space I only show the relevant columns in the header and for the histogram only the rows that are related to the queries we will be testing later. The main thing to notice in this output is that the EQ_ROWS column is way off in both cases.
| Name | Updated | Rows | Rows Sampled | Steps | Density | Average key length | Unfiltered Rows |
|---|---|---|---|---|---|---|---|
| IX_testtable | Dec 28 2016 10:17AM | 9350000 | 181876 | 198 | 0.005068779 | 12 | 9350000 |
| RANGE_HI_KEY | RANGE_ROWS | EQ_ROWS | DISTINCT_RANGE_ROWS | AVG_RANGE_ROWS |
|---|---|---|---|---|
| 230 | 36883.87 | 27500.71 | 4 | 9220.968 |
| 1574 | 27662.9 | 18333.8 | 3 | 9220.968 |
Next we will run a couple of queries against this table and use SQL Profiler to capture some performance statistics. Below is the T-SQL for our test queries and the performance statistics gathered from SQL Profiler after executing them.
SELECT * FROM [testtable] tt inner join [test] t ON t.col1=tt.col1 WHERE t.col1=230;
SELECT * FROM [testtable] tt inner join [test] t ON t.col1=tt.col1 WHERE t.col1=1574;
| QUERY | CPU | READS | DURATION | ROWS |
|---|---|---|---|---|
| t.col1=230 | 734 | 55185 | 1019 | 10000 |
| t.col1=1574 | 15 | 10672 | 252 | 10000 |
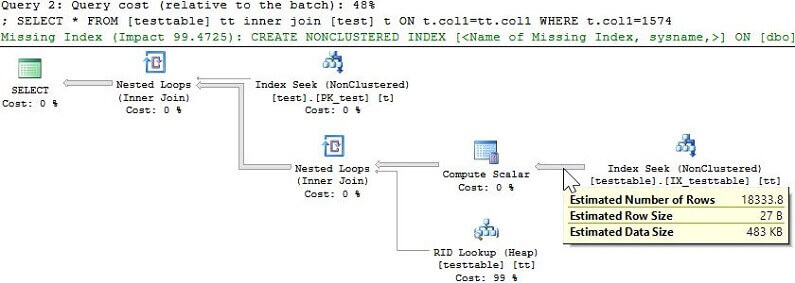
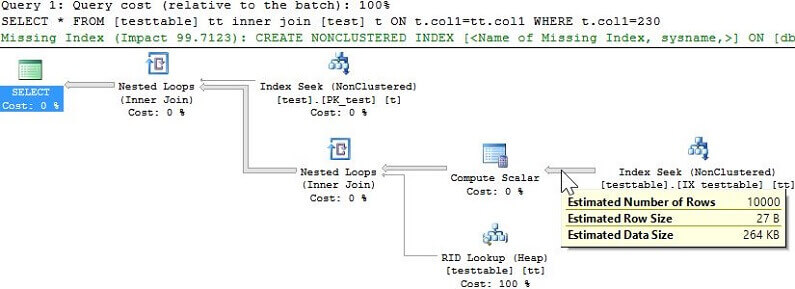
We can see from the statistics above that the query with the really bad row estimate for the column we are querying, ~27500 rows, performs much slower than the query with the better estimate, ~18333 rows. Let's take a look at the explain plan that the optimizer came up with for both of these test queries to see if that can shed any light on why one was slower.


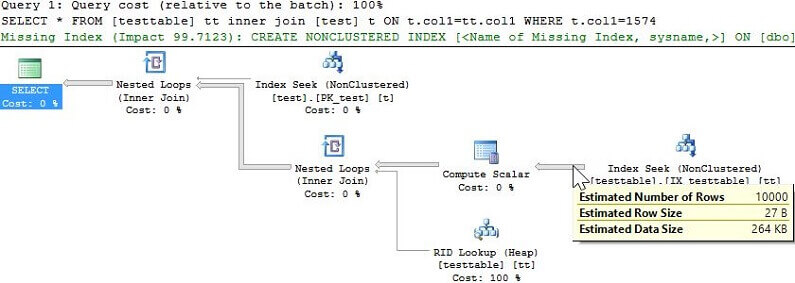
It's easy to see looking at these explain plans that the one with the really bad row estimate is doing a table scan and that is what is causing it to use more resources and take longer to complete. Based on these two explain plans we can say that for some row estimate greater than 18333 rows the optimizer is going to choose to perform a full table scan rather than the row id lookup it's doing in the other case. Let's now update the table statistics and perform full scan to gather more accurate statistics and check the results. Below is the T-SQL to perform the full scan as well as the DBCC command we used earlier with its output. Note that in some cases, especially on really large tables, you might not need a full scan in order to get more accurate statistics. It all depends on your data.
UPDATE STATISTICS testtable IX_testtable WITH FULLSCAN;
DBCC SHOW_STATISTICS ('testtable','IX_testtable');
| Name | Updated | Rows | Rows Sampled | Steps | Density | Average key length | Unfiltered Rows |
|---|---|---|---|---|---|---|---|
| IX_testtable | Dec 28 2016 10:52AM | 9350000 | 9350000 | 194 | 0.0001 | 12 | 9350000 |
| RANGE_HI_KEY | RANGE_ROWS | EQ_ROWS | DISTINCT_RANGE_ROWS | AVG_RANGE_ROWS |
|---|---|---|---|---|
| 226 | 50000 | 10000 | 5 | 10000 |
| 238 | 50000 | 10000 | 5 | 10000 |
| 1568 | 30000 | 10000 | 3 | 10000 |
| 1576 | 30000 | 10000 | 3 | 10000 |
Now that we have some more accurate statistics let's run our test queries again. Here are the performance statistics that were gather using SQL Profiler.
| QUERY | CPU | READS | DURATION | ROWS |
|---|---|---|---|---|
| t.col1=230 | 31 | 10838 | 207 | 10000 |
| t.col1=1574 | 32 | 10751 | 131 | 10000 |
We can see from above that with the more accurate statistics the performance of each query is quite similar and we can take a look at the explain plans again for each to confirm there is no longer table scan being performed.


Summary
Now even though this was a very simple example that was used to illustrate this point it's easy to see how a bad statistics estimate can lead to sub-optimal execution plans. In the real world it may not be so obvious with the poor plan performing a table scan. It might be something more subtle like the table join order or join type that causes the slowness. In any case if you have queries that perform well for some values, but poorly for others checking the statistics histogram and the sample rate is a good place to start your troubleshooting.
Next Steps
- How to Interpret DBCC SHOW_STATISTICS output
- Read more on SQL Server auto update statistics options
- Other tips on statistics
About the author
 Ben Snaidero has been a SQL Server and Oracle DBA for over 10 years and focuses on performance tuning.
This author pledges the content of this article is based on professional experience and not AI generated.
View all my tips


