By: Joe Gavin | Comments | Related: > Azure
Problem
You want to create an alert in Log Analytics to monitor Performance Monitor counters and / or Event Logs and need a quick way to jump in and get familiar with it.
Solution
Log Analytics is a service in Operations Management Suite (OMS) that monitors your cloud and on-premises environments to maintain their availability and performance. It collects data generated by resources in your cloud and on-premises environments and from other monitoring tools to provide analysis across multiple sources. (Source: https://docs.microsoft.com/en-us/azure/log-analytics/log-analytics-overview)
Digging deeply into this service is out of scope for this tip. However, diving in and creating a simple alert is a great place to get started.
We’ll walk through the following:
- Creating a Workspace - A workspace is the basic organizational unit for Log Analytics.
- Installing and configuring the Microsoft Monitoring Agent - The agent is the conduit from Windows and / or Linux monitored machines back to Log Analytics.
- Creating an alert - We can create alerts based on Windows Event Logs, Windows Performance Counters, Linux Performance Counters, IIS Logs, Custom Fields, Custom Logs and Syslog. In our example, we’ll keep it simple and get started with an alert based on the ‘% Processor Time’ Windows Performance Counter.
We’ll have a functioning Log Analytics alert when we’re done.
Creating a Workspace
Let’s get started.
Login to the Microsoft Azure Portal at http://portal.azure.com.
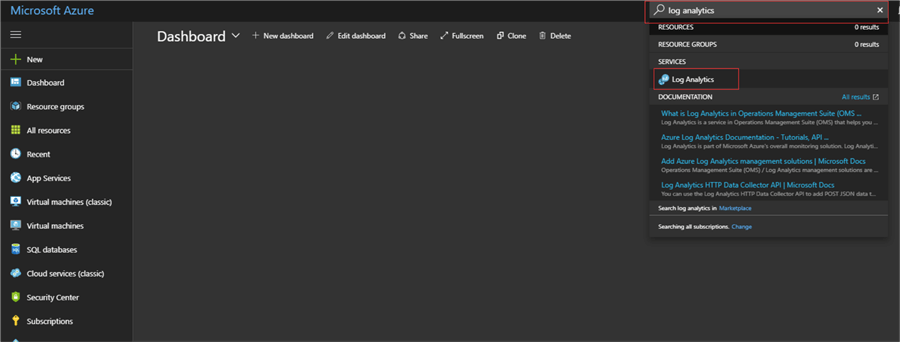
Start typing Log Analytics in the search box (as shown below) and click on Log Analytics when it comes up in the results.
Then click on Add.

- Name your new, uniquely named OMS Workspace
- Choose your Subscription
- Create a new or use an existing Resource Group
- Choose Location
- Choose Pricing Tier
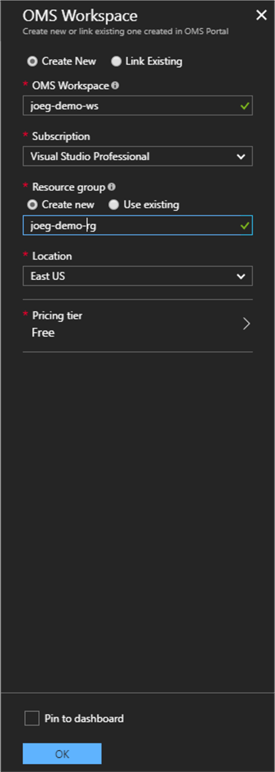
Then click OK.
Wait for the deployment to complete and click Refresh.
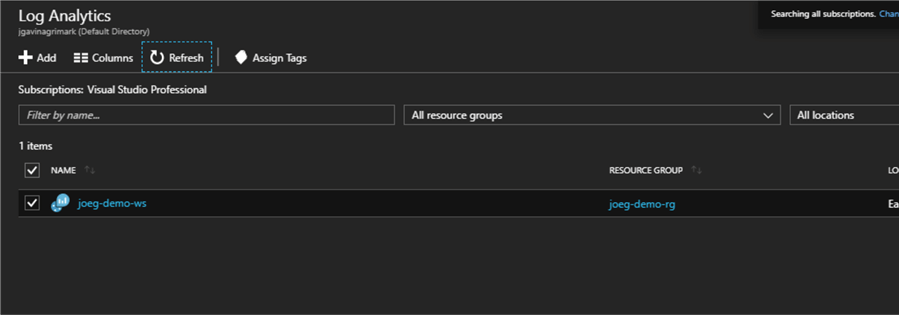
You will now see the new Workspace we just created. Go ahead and click on it.
Click on OMS Portal (it will open in another tab).
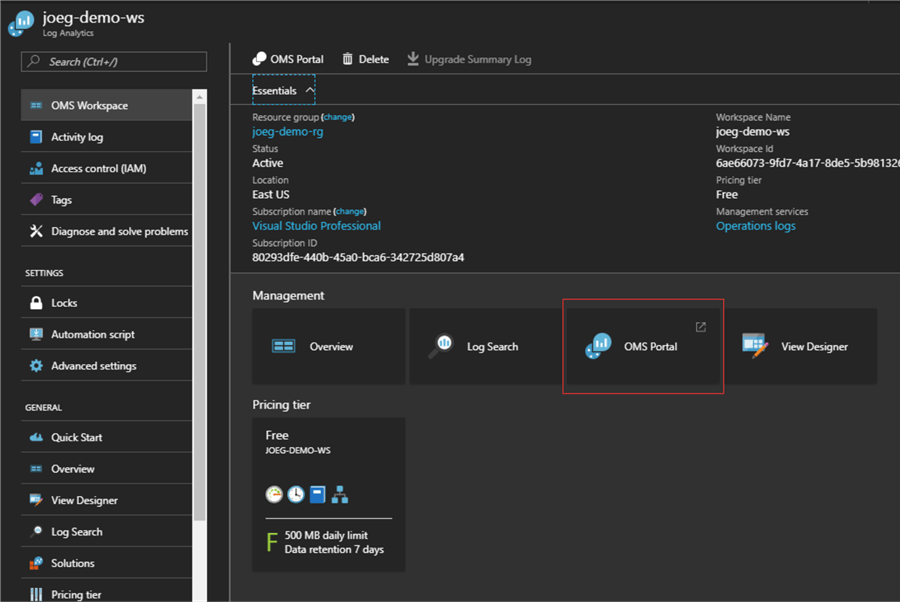
Click on the Settings icon in the upper right hand section of the OMS Portal.

Installing the Microsoft Monitoring Agent
At this point we are not monitoring any machines and need to install the Microsoft Monitoring Agent on any machines we want to collect data from.
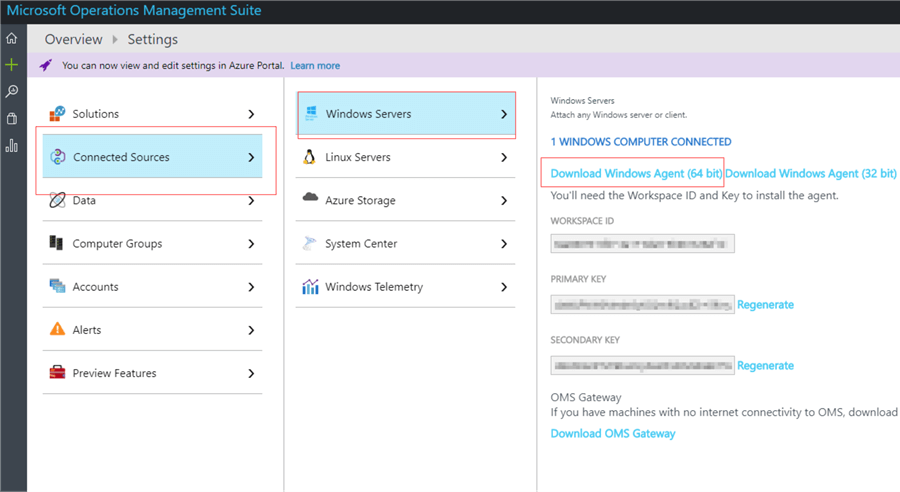
Choose Connected Sources > Windows Servers.
Click on ‘Download Windows Agent (64 bit)’ (presuming you’re installing on a 64 bit machine) to download the installer to your machine.
Go to the desktop of the Windows machine you want to install the agent on and run MMASetup-AMD64.exe from the location you saved it.
Click through until you get to the Agent Setup Options screen and check ‘Connect the Agent to Azure Log Analytics (OMS)’.
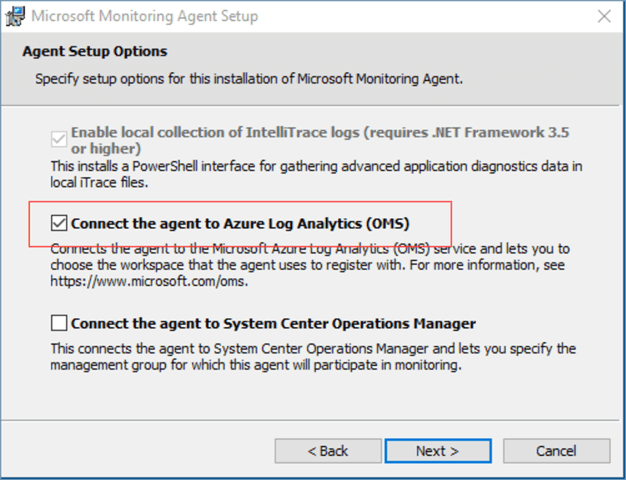
Then click Next.
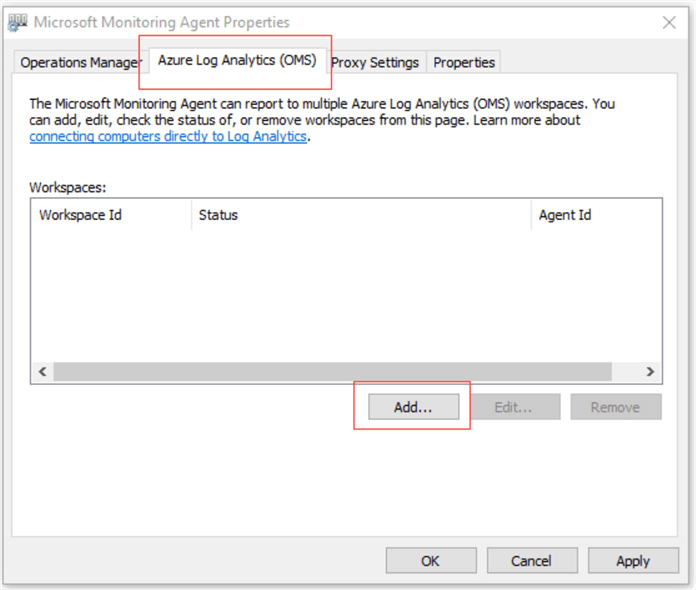
On the Azure Log Analytics (OMS) tab, click Add.
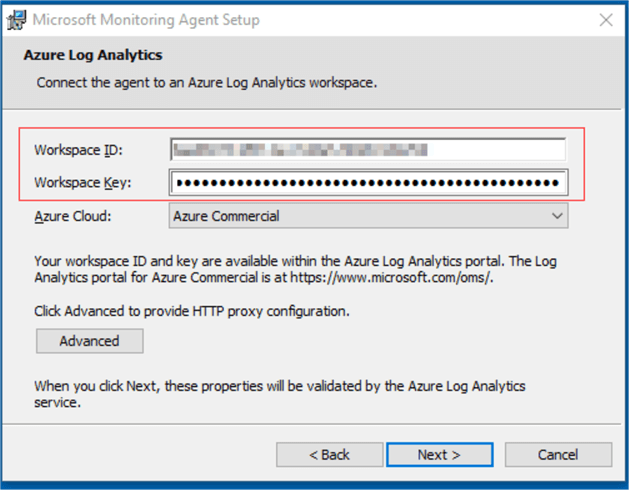
Copy and paste the Workspace ID and Key from Windows Server window in the OMS Portal, then click Next.
Then click Install and then Finish.
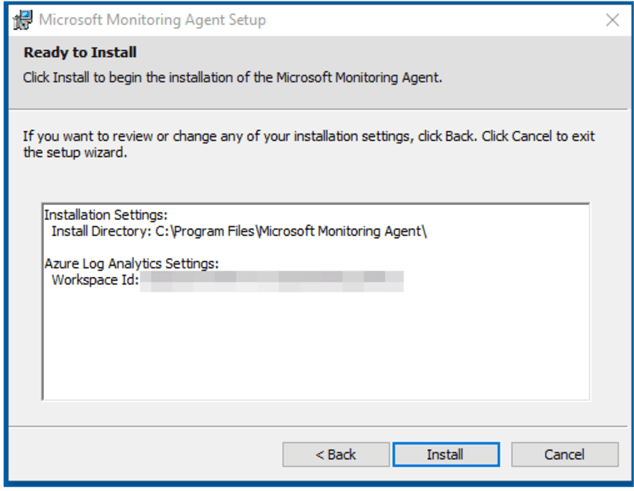
The agent is installed. Repeat for other machines. This process can be automated and installed on multiple machines, but that’s a topic for another tip and day.
Creating an Alert
Now we can go back the OMS Portal.
Let’s create an alert to tell us when CPU goes over a threshold of 90% on a machine we are monitoring.
On the left side of the screen, click on the Log Search icon and this opens the Log Search window.
(1) Paste the following in the search window (Note: this is based on the new Log Analytics Query Language):
Perf
| where ObjectName == "Processor"
| where CounterName == "% Processor Time"
| where InstanceName == "_Total"
| where CounterValue > 90
(2) Click on the Search button on the right to see if there are any records. In this case we have no values over 90%, so there are no records returned in the results section.
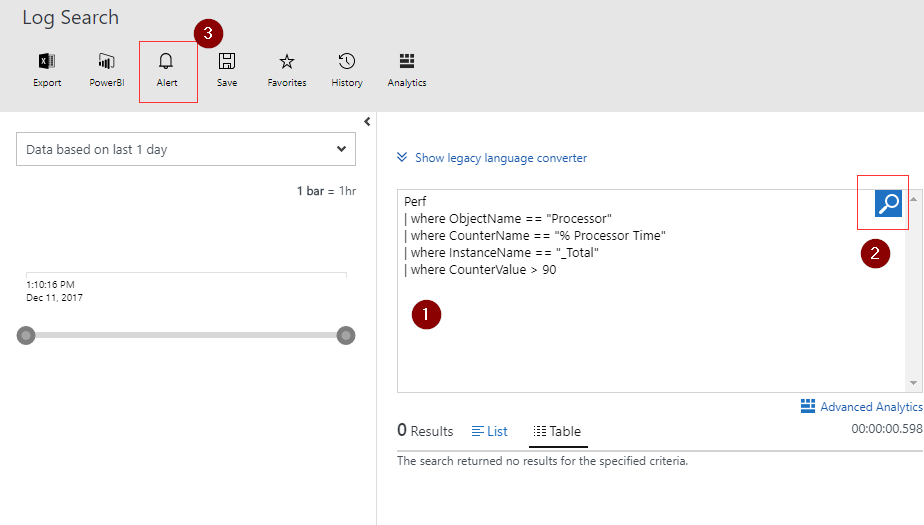
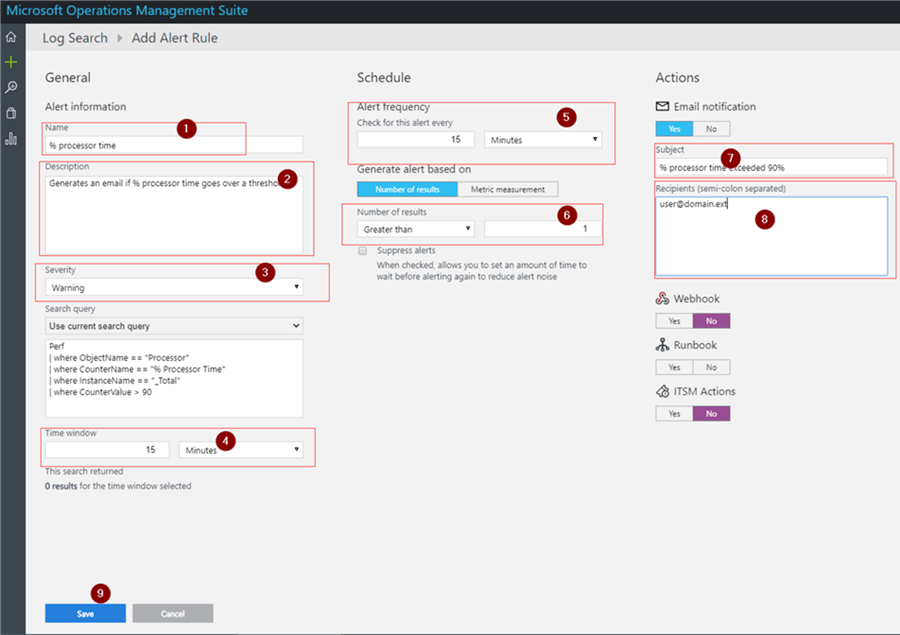
(3) To turn this query into an alert, click on the Alert icon in the upper left as shown above and the window below will open.
Enter values for:
- Name
- Description
- Severity
- Time window
- Alert frequency
- Number of results
- Subject
- Recipients
- and the click Save to save the alert.
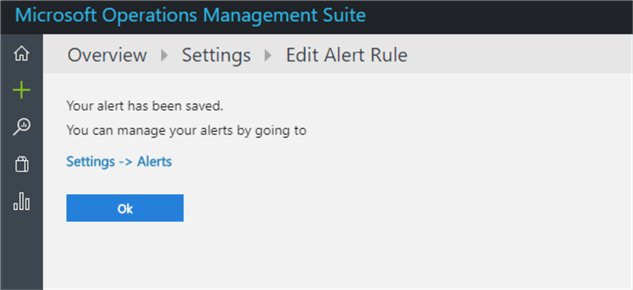
After saving the Alert, you will get this window.
When we look at the alerts that were setup, we can see them as shown below.
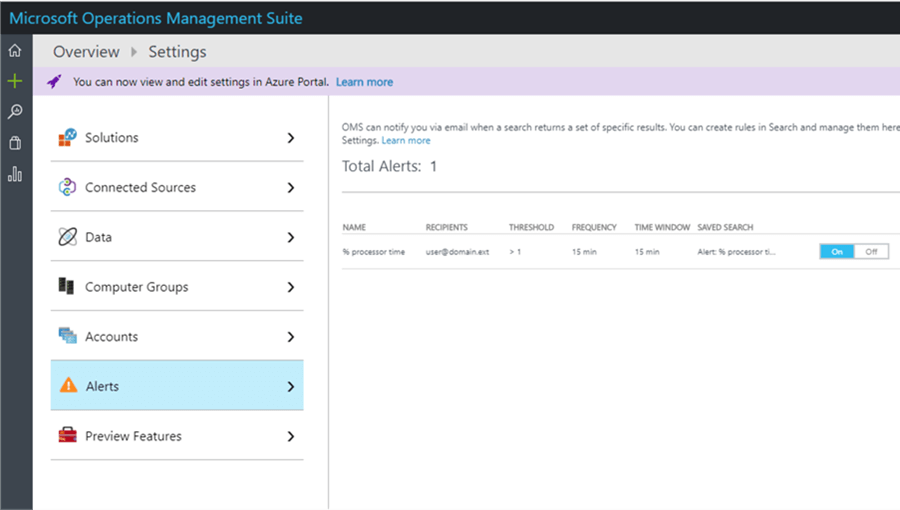
And we’re done.
Next Steps
- As stated at the beginning, there is much more to Log Analytics than could possibly be covered here. This tip was written just to get us started. And at this point we just have one simple alert in place.
- Here are some useful links to help you continue:
- Tutorial on the new language: https://docs.microsoft.com/en-us/azure/log-analytics/log-analytics-tutorial-viewdata
- Great chart to formulate you want to do in SQL and convert it to a Log Analytics query: https://docs.loganalytics.io/docs/Learn/References/SQL-to-Azure-Log-Analytics
- The official Microsoft documentation that has a wealth of tutorials, reference, how-to guides, etc.: https://docs.microsoft.com/en-us/azure/log-analytics/
- Watch here for future tips on Log Analytics.
About the author
 Joe Gavin is from the Greater Boston area. He started working with SQL Server and Sybase in 1998 in the financial services industry and has been a SQL Server Database Administrator for a dairy cooperative since 2011. He graduated from Northeastern University in Boston with a Bachelor of Science in Engineering Technology (BSET) degree in Computer Technology. Joe has spoken at the Boston and Providence SQL Saturday events.
 This author pledges the content of this article is based on professional experience and not AI generated.
View all my tips


