Problem
Microsoft Visio is generally the diagramming tool of choice for a variety of diagramming needs like use-case modeling, infrastructure design, entity relationship modeling, etc. Since Visio has been around for a long time and there tends to be a large repository of Visio diagrams in every organization. A data driven Visio diagram is a popular application in SharePoint where each diagram changes color and values according to the data attached to it. And due to this, the diagram itself gets used as a dashboard. Power BI Desktop is the recommended reporting tool for a variety of reporting needs and with the ability to integrate data driven Visio diagrams in Power BI can enhance the report intuitiveness and data relevance to a considerable extent. In this tip we will learn how to achieve this with Power BI Desktop.
Solution
Visio visuals (in preview as of the writing of this tip) is available in Power BI Desktop from the Power BI Visuals Gallery, which can be used for integrating Visio diagrams in Power BI Desktop.
We need to have access to certain software in order to develop the demo report that we will be discussing in this tip. You will need to have Power BI Desktop and Microsoft Excel installed on the machine where you will be developing the report. You will need to have access to OneDrive for Business or SharePoint Online. You can also setup a free SharePoint Online account from here. We will need a sample Visio diagram and sample data that we will attach to this diagram. You can download a sample Visio diagram from and the sample data from here. This samples are marketing leads data and a diagram available from Microsoft.
If you open the Excel file, the data should look as shown below. Each item in this dataset is a represented by an icon (a square / rectangular box) in the Visio diagram.

In this tip, we will integrate and render a Visio diagram in Power BI Report using the above dataset. Follow the steps as mentioned below.
Step 1
The first step is to download the Visio visual from here, as it is not available by default in Power BI Desktop. It is published by Microsoft and is still in preview as of the writing of this tip.

Step 2
You do not need to have Visio installed on your development machine. This control supports Visio files hosted on OneDrive or SharePoint online only. So, you need to upload this file on one of them. If you upload to SharePoint online, it should look as shown below.

Step 3
Once the file is uploaded, if you click on it to open, you should be able to see the Visio diagram in the browser. Copy the URL after opening the file, this is the URL we will be using while pointing at the Visio file in the Visio visual in the Power BI report.

Step 4
After downloading the sample Visio file, open Power BI Desktop. You can click on the ellipsis in the visualization tab and select “Import from file” menu option. This will open a dialog box to select the visualization package file, to add the visualization in Power BI. Select the downloaded file and it should add the Visio visual to Power BI Desktop visualizations gallery.
Step 5
Click on the Visio control and it will add it on the reports layout. Enlarge the control to occupy the screen space and it should look as shown below.

Step 6
Now that we have the visualization, it is time to populate it with data. Click on the Get Data menu and select Excel as shown below.

Step 7
Navigate and point to the sample Excel file that you downloaded earlier. After you select it, you will be able to preview the data as shown below. Select Table1 and load the data.

Step 8
After loading the data, select the ID field from the fields list and add it to the ID section of the control. This will bring up the option on the Visio control to select the Visio file as shown below.

Step 9
Point to the Visio file by pasting the URL that we captured in Step 4. This should be the URL of OneDrive / SharePoint Online which points to the Visio diagram. Once you paste this URL and click on Connect, it may prompt you for credentials. Provide these so it can connect to the Visio file and render the diagram as shown below.

Step 10
Now add the Gap field to the values section. This will change the color on the diagram as shown below. We will cover how these colors are formed and how these can be customized.

Step 11
Add the actuals and target values and these will be shown as text above the corresponding parts of the diagram.
Step 12
Expand the field mapping section in the diagram as shown below. One point to note is that the ID of each box in the diagram is the same that we have in the ID of the dataset. So, based on this, the components in the diagram are matched. Two of the boxes in blue are not matched with any ID in the dataset. The reason is that the ID of both these boxes is blank in the Visio diagram.

Step 13
Click on the blue box in the diagram, and check any of the matching values in the list that are unchecked. This will associate the box with the item in the dataset. Once you complete this for both the boxes in blue, the diagram should look as shown below.

Step 14
We can see the actual and targets on each phase of the process i.e. each box in the diagram. But we want to understand the logic based on which these boxes are colored. Expand the Gap field in the values section, as you should be able to see the thresholds based on which the colors are assigned.

Step 15
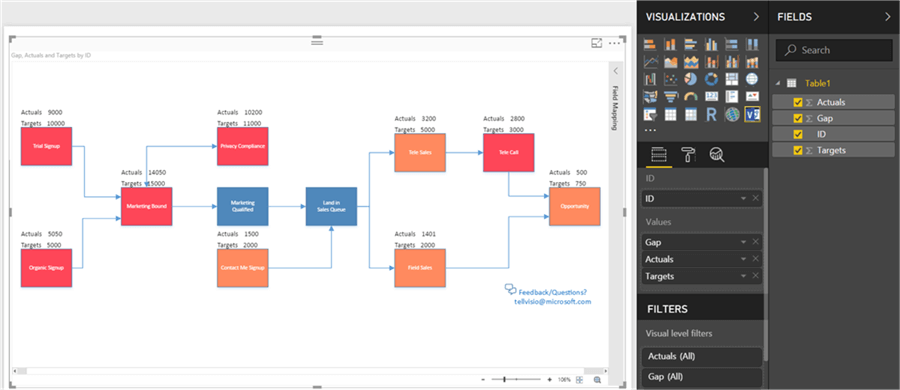
You can select any value to be displayed as Color or Text. Showing actual and target values as text and the gap between these fields in the form of colors seems logical, so we will not change it for now. But let’s change the colors. The threshold where the gap is maximum can be colored as red, and other colors can be given to other thresholds as per your preference. And this would change the colors on the boxes in the diagram as shown below. One can easily figure out from the diagram that all the phase or steps of the marking processes are zero to fifty percent away from their targets, based on the color coding of the boxes in the diagram.

Step 16
After you are done with the customization, you can collapse the field mapping and the diagram should look as shown below. On the bottom of the Visio visual, you can see the options to zoom and scroll the diagram, as generally diagrams tend to be wide and lengthy with vertical and horizontal scroll bars.

In this way, we can integrate a data driven Visio diagram in Power BI Desktop without the need to install Visio on the local machine. The diagram as well as data can be hosted on OneDrive or SharePoint online, and with just Power BI Desktop on the local machine, one can analyze the data in the context of the Visio diagram, and associate the data with other components in the Power BI Report as well.
Next Steps
- Try to use a more complex dataset with a more complex Visio diagram, and integrate the same in a Power BI Report.
- Check out these other Power BI tips

Siddharth has more than 14 years of experience in the IT Industry, with more than a decade of experience in Business Intelligence and Analytics, for clients banking, logistics, government, Media Entertainment, products, life sciences and other domains. He has been a lead architect for a portfolio of 40+ apps, containing apps in web, mobile, BI, Analytics, data warehousing, reporting, collaboration, CMS, NoSQL and other technologies. He has several certifications and is a published author for online and print-media publications, as well as the MSDN Library.
In his present role, he remains responsible for architecture design, technology stack selection, infrastructure design, 3rd party products evaluation and procurement, and performance engineering. These applications use technologies like Elasticsearch / Lucene, MongoDB, SharePoint 2013 and 2010, jQuery-based framework like Highcharts and GoJS, SQL Server and the Microsoft Business Intelligence stack (SSIS, SSAS, SSRS, MDX, PowerPivot, PowerView), jQueryMobile, Bootstrap, iOS xCode framework, and many others.
- MSSQLTips Awards: Champion (100+ tips) – 2018 | Author of the Year – 2017 | Author Contender – 2016, 2018-2019


