Problem
I have heard the new Power BI Desktop can screen scrape data off websites; how does that process work?
Solution
In a previous tip, Getting Started with Power BI Desktop, we described in detail the new Power BI Desktop (AKA Power BI Designer) that Microsoft has added to the Power BI tool set. Of course just as the tip was published, Microsoft renamed the tool from Power BI Designer to Power BI Desktop (PBID). Even so, the basics of the tool and the details in the tip still apply. Getting the designer is easy as the Power BI Desktop is available for download at: https://powerbi.microsoft.com/downloads.
The current edition of the software is available free of charge and Microsoft has indicated that the tool will continue to be free. Of course that could change. Finally to publish the PBID reports to the web, you must have an account setup on the Power BI site. Furthermore, in order to publish to the web, you have two options, one free and one a paid version. The exact pricing details are described here: https://powerbi.microsoft.com/pricing.
Before I go too far I need to warn you that the tool is still in its early stages. Features are being added ( and some removed ) every month. With all these changes and updates, Microsoft is currently releasing an updated application about once per month. You can see the latest version information on the Microsoft Power BI Support page at: https://support.powerbi.com/knowledgebase/articles/489224-what-s-new-in-the-latest-power-bi-designer-preview.
Fortunately one of the neatest data source options is to retrieve data from a web page. Of course not all web pages work especially ones that are very media rich. The biggest item needed to bring the web to the Power BI Desktop is having well formed html tables. The table tags seem to be the key component for pulling data from a web page. Furthermore, web queries can also interact with certain document properties.
Web Datasource for Power BI Desktop
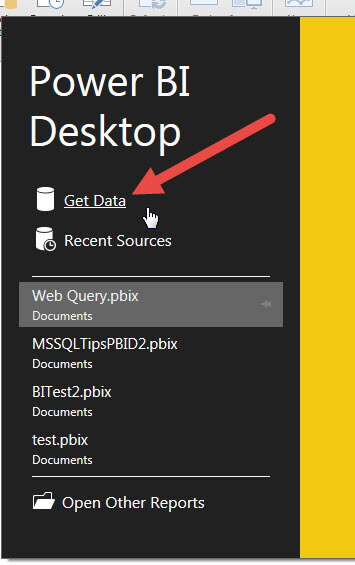
Our first step is to create a new document in PBID; next on the Start Window, we select the Get Data option, shown below, which will start the Get Data Wizard.
Next, we select All from the data source category on the left side. Then scroll through the list on the right side of the window until you find and select Web and then select Connect.

We next provide the URL where the data we would like to import resides; for our example I am using a list of cities and their weather information found at: http://www.infoplease.com/ipa/A0762183.html. An example of the page is shown in the second screen print below.


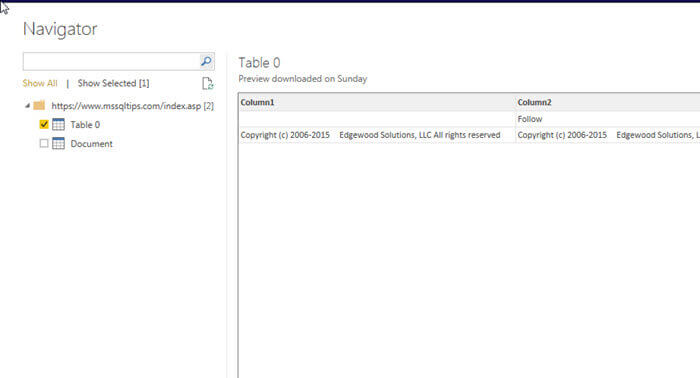
Yes, it is as simple as filling in the URL and clicking OK. The results of the web query are shown below. Actually two sets of data were found at the noted URL. The first PBID aptly names Table 0. The preview in the below screen print shows the data that is contained in Table 0; you may notice that the table requires some clean up which we will discuss later in the article. Overall though the table from the web page matches the data that was loaded into the PBID query preview.

The second element that was imported is labeled document. As you can see from the below screen print, this item contains just a single row of data with information from the html document tag. I have found in most cases, this element does not contain useful information.

Of course not all websites contain “nice and pretty” HTML tables. Although the MSSQLTips.com website is a great site and wonderful looking, it does not import well. As shown below, this situation is expected as site is more textual in nature as opposed to displaying rows and columns of data in a table format!
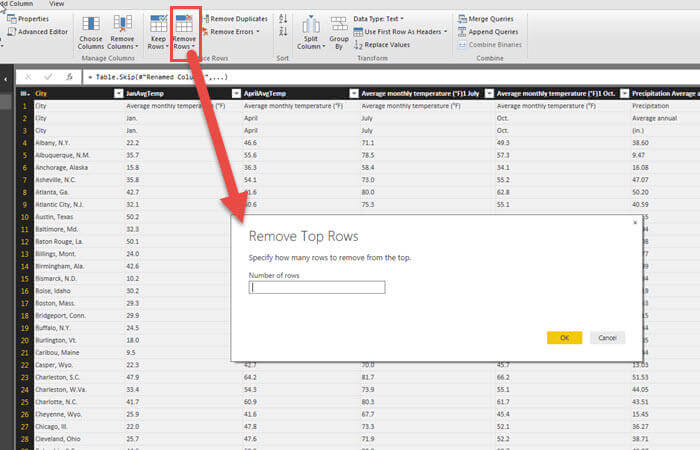
Moving back to the weather data example, even after loading the website table, we have some cleanup to do on the set. First, you will notice that the first three rows are duplicate of the header row. So in the Query Editor we can select Remove Rows from the ribbon to delete the first three rows of the dataset.
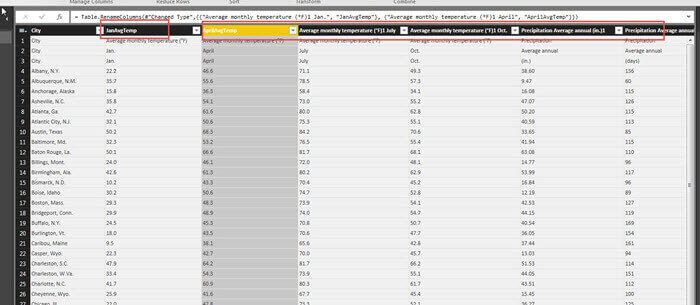
Next, we want to update the names of columns; as shown now we can easily do that by simply double clicking on the column header and then completing the appropriate renaming.
After renaming the field, we next are going to split the number of years observed field to parse out the two values. The first step to split the column values, illustrated next, is to Select Split Column, then click By Delimiter. The Split Column by Delimiter window opens. We need to select custom in the Select or enter delimiter field and then for our data set, use a “\” as the delimiter. We want the break to occur at every delimiter (we know there is only one, but we could actually split the column value into more than two columns which could be handy for a comma delimited string). Finally, we complete the number of columns to split into; two in our example.
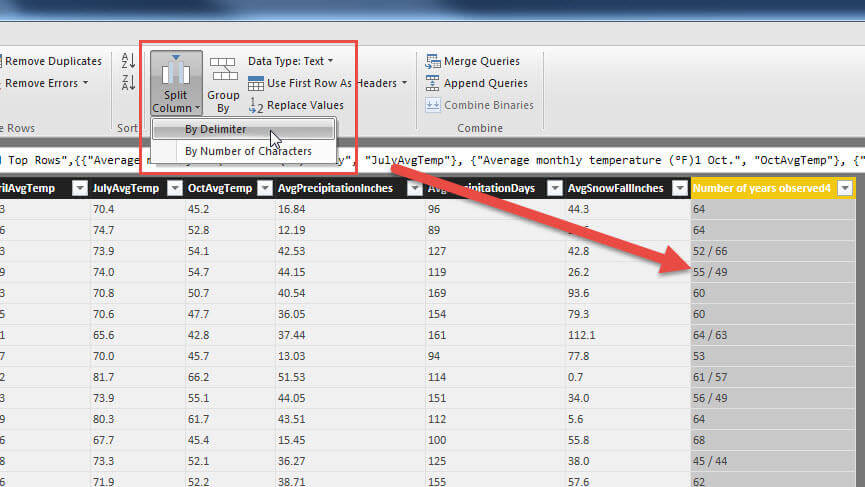

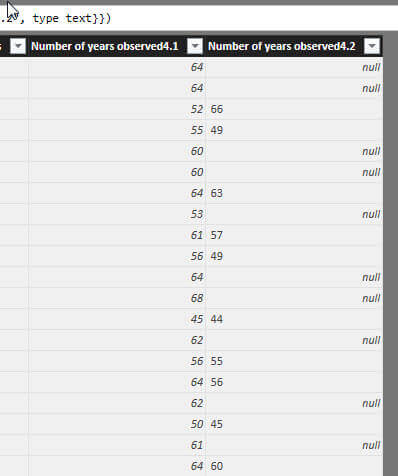
The split results in two “Number of years observed” columns. You will notice that the column ending in 4.2 in the below screen print is left aligned. That tells us that the data is considered text.
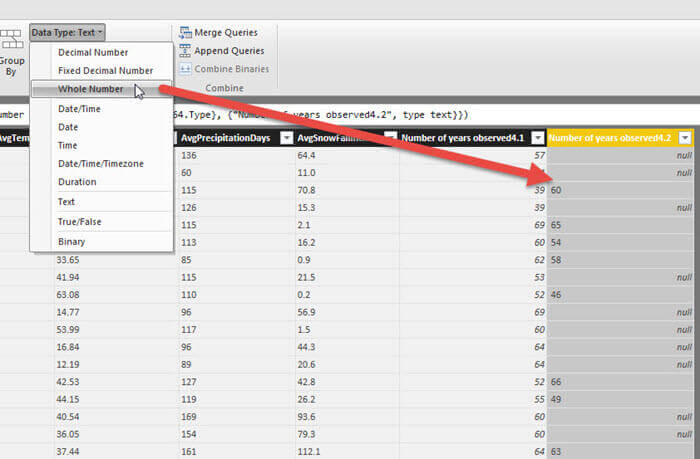
Fortunately, we can adjust the data type easily by selecting the data type option from the ribbon, and for this example selecting Whole Number. As shown in the second screen print below, the column is now left aligned and the data type is now whole numbers. At this point, I would also like to point out that all the data transformations and changes we are making are recorded in the Applied Steps window under the table properties. This window acts much like an Undo function in that you can click on the X to the left of any step to remove that step.
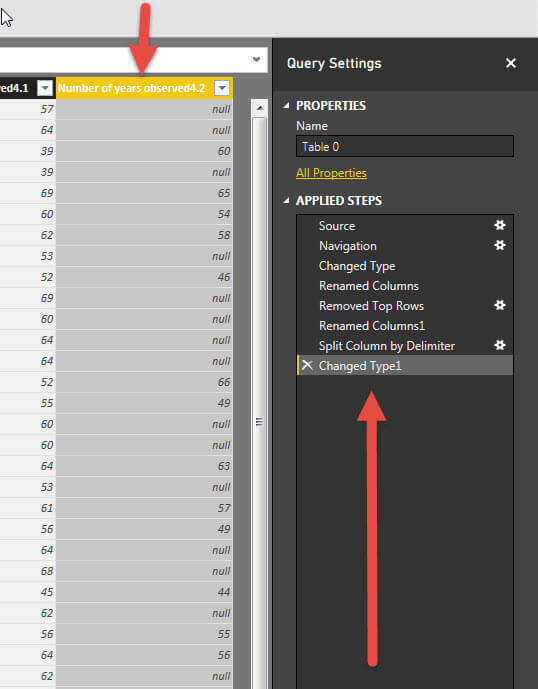
You will notice also that you can remove any step in any order. So as displayed in the below example, I could “Undo” or remove the step that removed the top 3 rows.

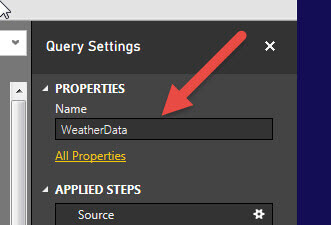
One other edit we could perform is to update the name of our query. Currently, it shows as Table 0 which is not very descriptive. As illustrated subsequently, we can click on “All Properties” which opens up the Query Properties window and allows us to change the Name of the query.

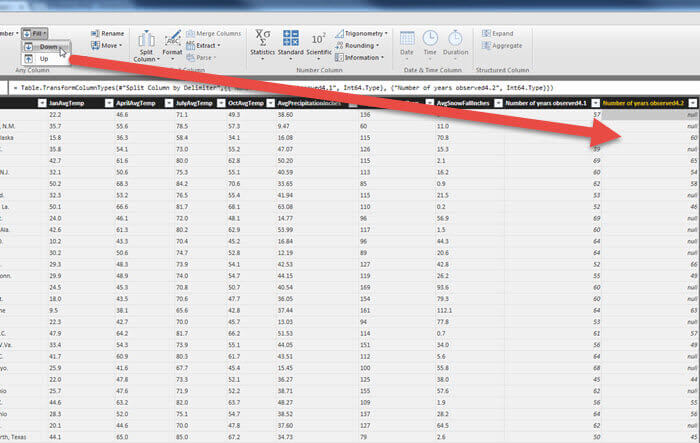
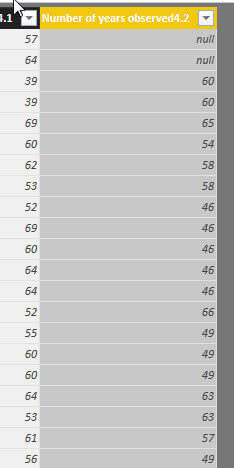
Another option we can use to transform our query data is to use the Fill Down option to “fill in” some of our column values. You may have noticed that the Number of years observed 4.2 column had many null values. Although it does not make complete sense for our weather data set, we can select the Number of years observed 4.2 column and select Fill > Down from the Transform table on the ribbon. This process fills in the null rows with the non null value immediately above the null field. Notice the results in the second screen print. This situation can be helpful when bringing in data from a pivoted data source.
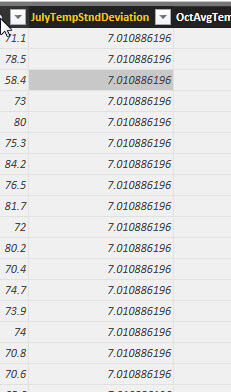
Our final transformation for this example is to add a custom calculated column / measure. As shown in the below screen print, we use the M Power Query Formula Language to determine the standard deviation of the July Average Temperature column.

The standard deviation results, illustrated next, provide a Standard Deviation measure column based on all the July Temperatures.
When we are finally satisfied with our query edits, we need to select Close and Apply to return the query data set to the Dashboard Visualization Design grid.

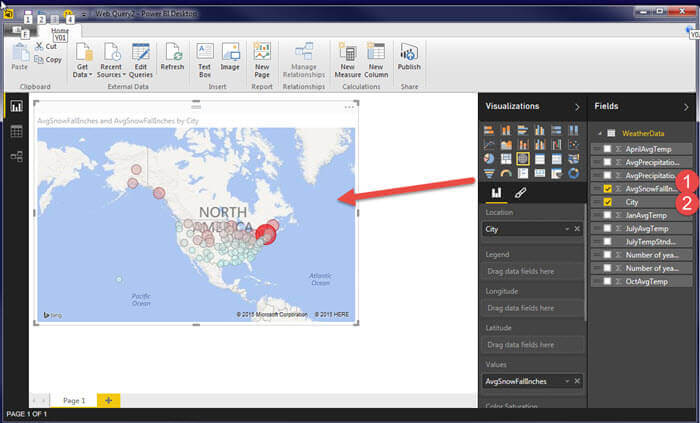
Here is one of the really neat features of PBID. Once we click on Close and Apply, the Dashboard Visualization Design grid opens and the Visualizations and Fields are immediately available to work with. As seen below, I selected the check box next to City in the field list. Immediately, the designer recognized that the field is a location data type and thus added a map. Next, I selected AvgSnowFallInInches and now a bubble map is created with each city in our weather list. I adjusted the colors on the map to show higher snow fall in red; the results are shown on the map (I will be doing a future tip on visualizations). As the data changes we could easily click the Refresh button on the ribbon and the data on the map would update.
Conclusion
In this tip we continued to explore the new Power BI Desktop (PBID); in particular, we covered how we can use the Web Query data source to pull data from a well formed table on a web page. Once the query retrieved the data from the URL, we used the Edit Query window to apply several transformation steps to the data. These steps included: 1) adding a standard deviation calculated measure column 2) removing header rows that repeated at the top of the data set 3) splitting a column using a delimiter and 4) changing the data type of a column. Finally, we used the transformed data to quickly create a Bubble Map.
Next Steps
- Getting Started with Power BI Desktop – https://www.mssqltips.com/sqlservertip/3681/getting-started-with-power-bi-designer/

I have a passion for crafting Business Intelligence Solutions for my user groups. My experience includes almost 15 years of SQL Server involvement with the last 12 years focused specifically on Business Intelligence, SharePoint, OLAP, SSRS, and Decision Support solutions. Currently, I am a Business Intelligence Architect in the healthcare industry, and I also teach database and analytics classes for Kennesaw State University, Southern New Hampshire University, and Reinhardt University. My education includes an MBA and an undergraduate in Accounting (yes I am a reformed accountant!), both from Kennesaw State University. I enjoy every day by trying to grow my faith and spend precious time with my family. I have been happily married to my wife of over 20 years, and we have two teenagers one who we home school with the help of a University Model School, Cornerstone Prep in Acworth, GA (cornerstoneprep.org). Our other child is a Construction Management major at KSU’s Southern Poly / Marietta campus. We are a soccer and Cross Country (XC) family who play, coach, and referee soccer or run for fun most every day. For several years, our family has volunteered (and played with the dogs and cats) at Etowah Valley Humane Society in Cartersville, GA.
- MSSQLTips Awards: Champion (100+tips) – 2016 | Author of the Year – 2015 | Author Contender – 2014, 2016-2021


