Problem
Collecting and analyzing performance metrics is a key task for database environments and Azure is no different. In this tip we look at how to create a performance monitor dashboard in Azure.
Solution
While it’s by no means a substitute for monitoring software, Azure Log Analytics with Azure Dashboards is a handy place to do some “roll your own” monitoring if you have the need.
Log Analytics lets you query gathered Performance Monitor and Event Log data and Dashboards are a handy way of viewing the visualized data.
Assumptions:
- You already have Azure Log Analytics
- The Microsoft Monitoring Agent is installed and configured on your servers of interest and collecting data
- You have some basic familiarity with querying Log Analytics
We’re going to walk through the following topics:
- Creating a new Dashboard
- Creating a couple of visualizations based on queries of some Perfmon counter results
- Making the Dashboard public
- Writing a query and pinning it to the Dashboard
- Editing the visualization
- Rearranging visualizations
- Resizing visualizations
- Exporting and importing our Dashboard
Create a New Microsoft Azure Dashboard
OK, let’s dig in. We’ll get started by creating a new Dashboard for our visualized query results.
- Login to your Azure Portal at http://portal.azure.com/. Your default dashboard will be displayed.
- Choose ‘New Dashboard’

- Give the dashboard a name. I kept it simple for our demo and just called it “Demo Dashboard” but you can call it what you like.
- Click ‘Done Customizing’

- Click ‘Share’
- Click ‘Publish’

The dashboard is now public, and queries can be pinned to it.
Build Visualizations with Log Analytics
We’ll leave the fresh canvas for a while and build some visualizations.
- Go to the left side of the portal and choose Log Analytics
- Choose your Log Analytics Workspace

- Logs
- Copy and paste this code into the query window:
Perf
| where ObjectName == "Processor Information" and CounterName == "% Processor Time" // show % Processor Time
| summarize AggregatedValue = avg(CounterValue) by bin(TimeGenerated, 10m), Computer // summarize average counter value
| sort by Computer asc // order by machine name
| render timechart // chart data
- Press the Run button

- Pin
- Choose dashboard
- Update

- Click on your dashboard name

- Click the edit icon in the visualization
- Enter the counter name in the Title box
- Optionally add the threshold you want in the Subtitle box for reference
- Update

- Publish changes

Add More Visualizations
Now we have an easily repeatable process and can rinse, lather and repeat.
- Go back to the query window and paste this in:
Perf
| where ObjectName == "Memory" and CounterName == "Available MBytes" // show Available MBytes
| summarize AggregatedValue = avg(CounterValue) by bin(TimeGenerated, 10m), Computer // summarize average counter value
| sort by Computer asc // order by machine name
| render timechart // chart data
- Run
- Pin
- Choose dashboard
- Update
- Click on your dashboard name
- Click the edit icon in the visualization
- Enter the counter name in the Title box
- Optionally add the threshold you want in the Subtitle box for reference
- Publish changes

And we can keep adding tiles if we like. To add a tile displaying Buffer Cache Hit Ratio.
- Go back to the query window and paste this in:
Perf
| where ObjectName == "SQLServer:Buffer Manager" and CounterName == "Buffer cache hit ratio" // show Buffer Cache Hit Ratio
| summarize AggregatedValue = avg(CounterValue) by bin(TimeGenerated, 10m), Computer // summarize average counter value
| sort by Computer asc // order by machine name
| render timechart // chart data
- Run
- Pin
- Choose dashboard
- Update
- Click on your dashboard name
- Click the edit icon in the visualization
- Enter the counter name in the Title box
- Optionally add the threshold you want in the Subtitle box for reference
- Publish changes
And we have another tile. (Note: the arrow points to a dip that’s slightly below what we want)

We have a few visualizations, so let’s go ahead and look at customizing the dashboard. We can easily resize and rearrange the tiles to suit our needs.
- Either hover in the upper right corner of the tile and click the ellipse of click the Edit button on the top of the Dashboard.

or

- Hover you mouse within tile and click to drag to a new location or click in the lower right corner to resize it
- ”Done Customizing’ when you’re done

- Publish Changes

And your back to your changed Dashboard.

Customizing the Azure Dashboard
Now that we have a few counters on our Dashboard and customized it, let’s see what else we can do.
- Refresh the query

- Edit title

- Edit Query

- Open Chart in Analytics Blade – this is where can dig deeper into the data

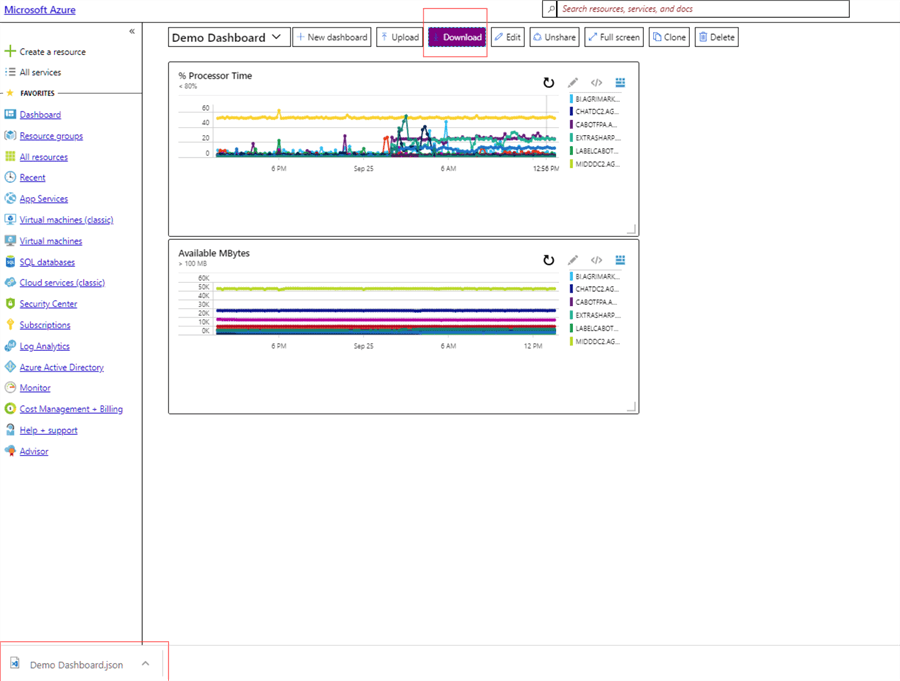
Create a Dashboard Template
Now we’ll create a template that can be used to import a new Dashboard and / or be used as a backup.
- Click the Download button and a .json file will be created in your default download directory.
One thing we can do with file is restore a deleted Dashboard.
- Delete
- Check confirmation box
- OK

Oops, it’s gone.
To restore it:
- Upload
- Choose file
- Open

- Share
- Publish

And we’ve restored back to where we were.
Summary
The easiest way to build dashboards is the way we’ve seen so far. It’s outside the scope of this tip, but the exported .json file can also be used can also be used as a Dashboard creation template. There is further documentation in the Next Steps section that will be of help.
Next Steps
Hopefully this tip has given you the steps to create an Azure Dashboard and this is by no means a deep dive into Log Analytics as we’ve just touched upon the topic, but hopefully this will help you with some basic Dashboard building. These links point to some more resources that reference Azure Log Analytics and Dashboards:
- https://docs.microsoft.com/en-us/azure/log-analytics/log-analytics-view-designer
- https://docs.microsoft.com/en-us/azure/azure-portal/azure-portal-dashboards-create-programmatically
- https://azure.microsoft.com/en-us/updates/upload-download-azure-dashboards/
- https://docs.microsoft.com/en-us/azure/azure-portal/azure-portal-dashboards
- https://www.mssqltips.com/sqlservertip/5397/easy-way-to-build-an-azure-log-analytics-query/
- https://www.mssqltips.com/sqlservertip/5272/create-an-alert-in-microsoft-azure-log-analytics/
- https://www.mssqltips.com/sqlservertip/5209/how-to-use-azure-sql-database-features-and-settings/
- https://docs.microsoft.com/en-us/azure/log-analytics/log-analytics-quick-create-workspace
- https://docs.microsoft.com/en-us/azure/log-analytics/query-language/get-started-queries

Joe Gavin is from Greater Boston and has worked in technology as a Field Service Engineer for an automotive dealer computer system vendor, a Technical Consultant and Operations Analyst with Sybase and SQL Server based database applications in financial services and now works as a SQL Server Database Administrator.
- MSSQLTips Awards:
- Achiever Award (75+ Tips) – 2024 | Author of the Year – 2021 | Author Contender – 2024 |
- Rookie Contender – 2018