By: Eli Leiba | Comments (8) | Related: > Monitoring
Problem
There comes a time when a DBA needs to know how much CPU resources each SQL Server database is using. This comes in handy in cases where you need to investigate high CPU usage on your SQL Servers or when you are just trying to understand the CPU heavy consumers on your server. There is no specific report in SQL Server Management Studio (SSMS) that gets you this information, so the T-SQL code presented will provide this information.
Solution
My solution involves creating a T-SQL scalar function in the SQL Server master database, called dbo.udf_Get_DB_Cpu_Pct that can take the database name as input and outputs the CPU usage percentage of the given database as a number between 0 and 100. There is also an example below that shows this for all databases.
This will enable the investigator (the DBA) to pinpoint the most CPU time consuming databases and assuming that each database relates to an application, it will identify the heavy database CPU aligned application.
The function uses a query with the following two dynamic views where the first is actually a view and the other is a table-valued function. The query uses the CROSS APPLY operator that works with the Database ID field that exists in both dynamic views with a GROUP BY clause on the Database ID fields and the aggregate SUM function on the total_worker_time column from the dm_exec_query_stats view.
The dynamic views that are used:
- sys.dm_exec_query_stats
- This DMV returns aggregate performance statistics for cached query plans in SQL Server.
- The view contains one row per query statement within the cached plan, and the lifetime of the rows is connected to the plan itself. When a plan is removed from the cache, the corresponding rows are eliminated from this view. Source - MSDN.
- sys.dm_exec_plan_attributes
- This DMF returns one row per plan attribute for the plan specified by the plan handle. This table-valued function to get details about a particular plan, such as the cache key values or the number of current simultaneous executions of the plan. Source - MSDN.
Important note: the DMVs can only report on the data that's available in the plan cache.
Here is the T-SQL code for the scalar user function:
USE master
GO

-- ===========================================================
-- Author:      Eli Leiba
-- Create date: 19-09-2019
-- Description: Get the CPU usage percentage for the given database.
--              Result should be a decimal between 0 and 100
-- ===========================================================
CREATE FUNCTION dbo.udf_Get_DB_Cpu_Pct (@dbName sysname)
RETURNS decimal (6, 3)AS
BEGIN

   DECLARE @pct decimal (6, 3) = 0

   SELECT @pct = T.[CPUTimeAsPercentage]
   FROM
    (SELECT
        [Database],
        CONVERT (DECIMAL (6, 3), [CPUTimeInMiliSeconds] * 1.0 /
        SUM ([CPUTimeInMiliSeconds]) OVER () * 100.0) AS [CPUTimeAsPercentage]
     FROM
      (SELECT
          dm_execplanattr.DatabaseID,
          DB_Name(dm_execplanattr.DatabaseID) AS [Database],
          SUM (dm_execquerystats.total_worker_time) AS CPUTimeInMiliSeconds
       FROM sys.dm_exec_query_stats dm_execquerystats
       CROSS APPLY
        (SELECT
            CONVERT (INT, value) AS [DatabaseID]
         FROM sys.dm_exec_plan_attributes(dm_execquerystats.plan_handle)
         WHERE attribute = N'dbid'
        ) dm_execplanattr
       GROUP BY dm_execplanattr.DatabaseID
      ) AS CPUPerDb
    )  AS T
   WHERE T.[Database] = @dbName

   RETURN @pct
END
GO
Sample Execution
Report database CPU percentage for the master database:
USE master
GO
SELECT dbo.udf_Get_DB_Cpu_Pct ('master')
GO
And the results are on my server:

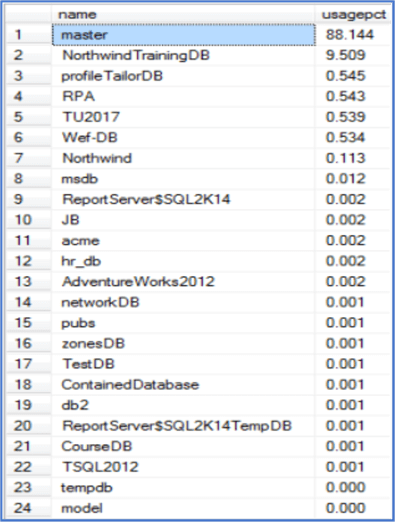
Report results for all databases in descending CPU usage order:
USE master
GO
SELECT d.name,dbo.udf_Get_DB_Cpu_Pct (d.name) as usagepct
FROM sysdatabases d
ORDER BY usagepct desc
GO
And the results are on my server:

Next Steps
- You can create and compile this simple scalar user function in your master database and use it as a simple T-SQL tool for information identifying the top CPU usage databases.
- The function was tested with SQL Server 2014 and SQL Server 2017
About the author
 Eli Leiba is a senior application DBA, a teacher and a senior database consultant with 19 years of RDBMS experience.
This author pledges the content of this article is based on professional experience and not AI generated.
View all my tips


