Problem
I’ve created a couple of charts and PivotTables using Excel. Can I share these with my coworkers in the Power BI service? Or do I have to create everything in Power BI Desktop? What is the difference between a dataset and a workbook?
Solution
In part 1 of this tip series, we gave an introduction to Power BI datasets, which are created in Power BI Desktop and uploaded to the Power BI service, the online platform where you can share your reports and dashboards within your organization. In this part, we’ll take a closer look at the workbooks feature of Power BI.
Workbooks
In short, workbooks are Excel files which are published to the Power BI service. There are two options for the data inside the Excel file:
- You leave everything as-is and you can browse the workbook using Excel Online
- Or you import the data into Power BI. In this case, the data will be converted to a dataset, so you can use it to create Power BI reports on top of it.
Let’s take a look at both options.
Upload an Excel File
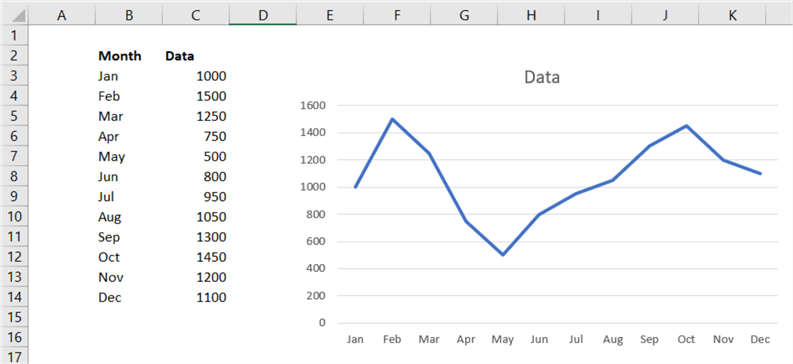
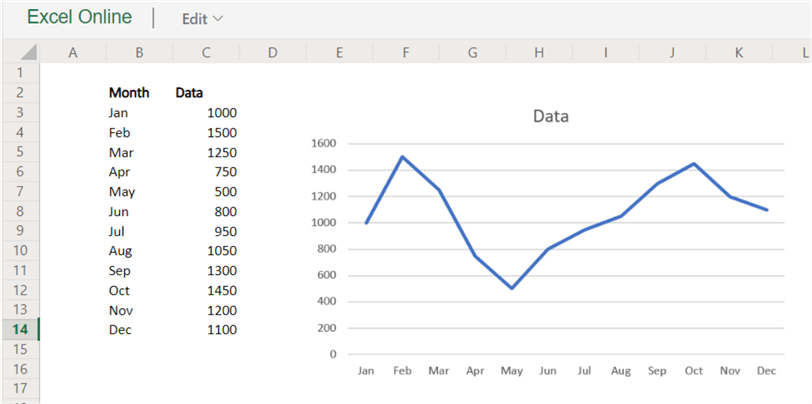
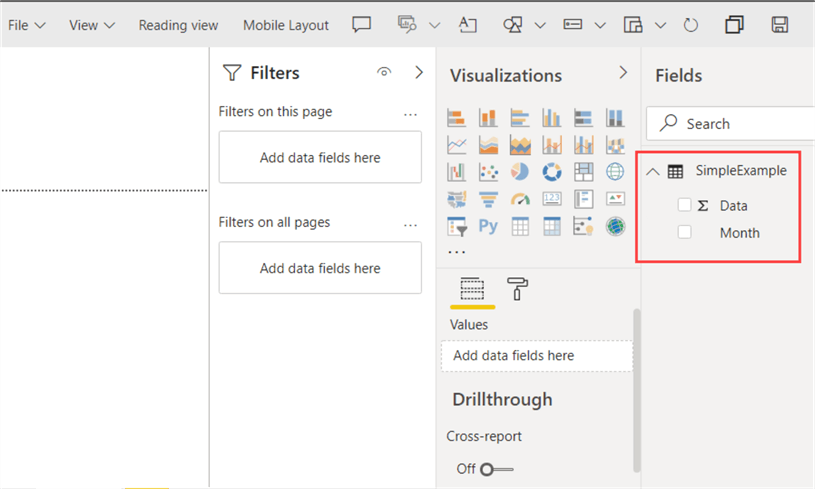
Suppose we have an Excel file with some data and a line chart (called SimpleExample.xlsx):
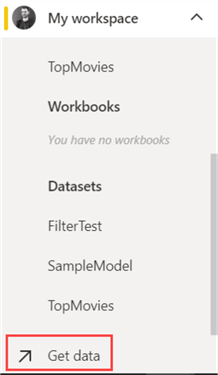
We can then upload the workbook to the Power BI service by choosing Get Data:
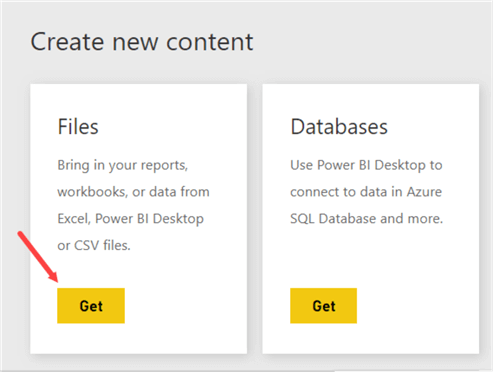
In the new screen, choose Files in the Create new content section.
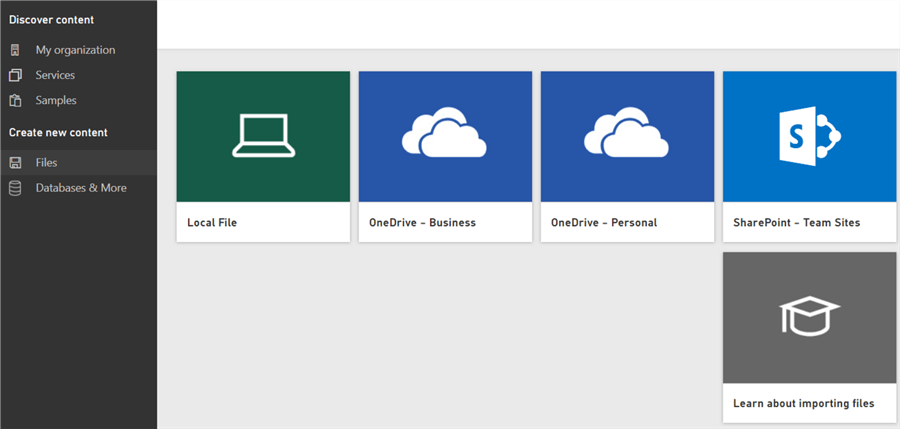
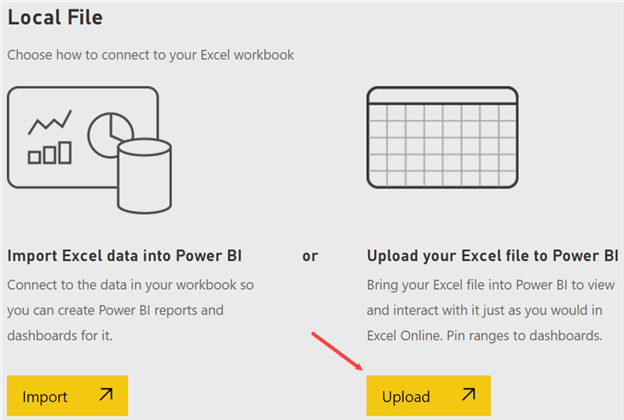
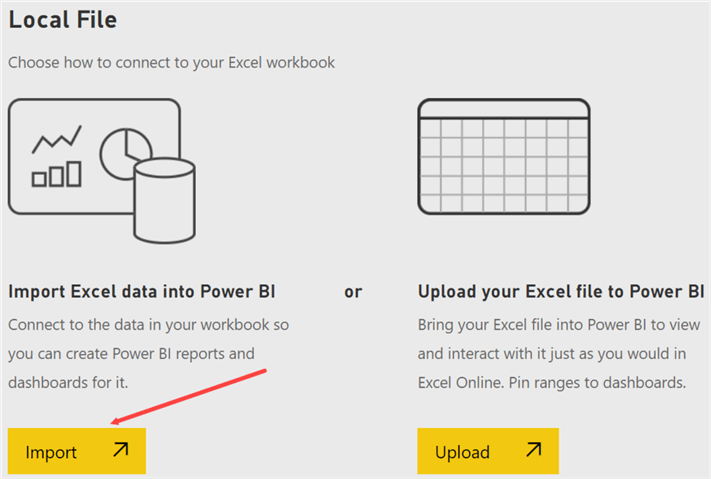
In the next screen, there are a couple of options for the file location. In our case, we’re going to choose the local file:
The OneDrive for Business option is a useful option if you want to automatically sync your workbook to Power BI. More information can be found in the documentation.
As mentioned, when using a workbook, you can choose between two options: uploading or importing. Let’s choose uploading.
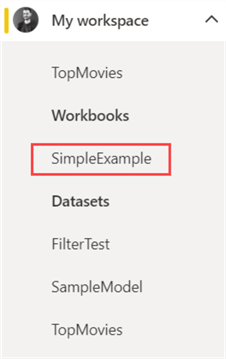
Once the file is uploaded, you can find it under the worksheets section of your workspace:
Clicking on the object will open up Excel Online inside the Power BI service, allowing you to browse the Excel workbook like you normally would:
It’s also possible to manipulate data, and the chart will change accordingly:
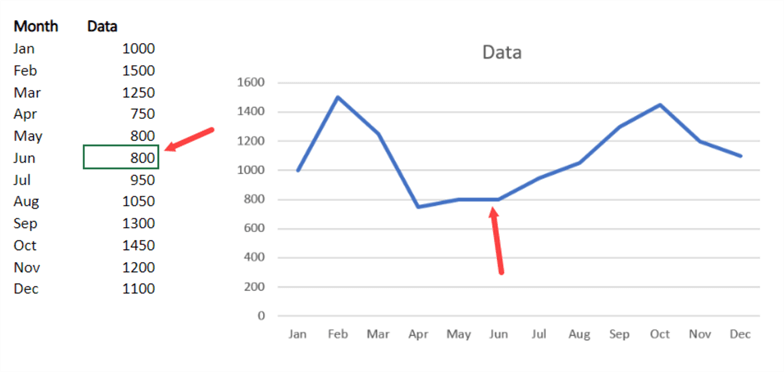
However, changes are not persisted.
Import an Excel File
The other option is to import the workbook and convert it to Power BI objects. To do this, select Get Data, click on Get in the Files section and choose Local File again. This time, choose the Import option.
However, you have to make sure the data you want to import is formatted as a table, otherwise you’ll get this error:
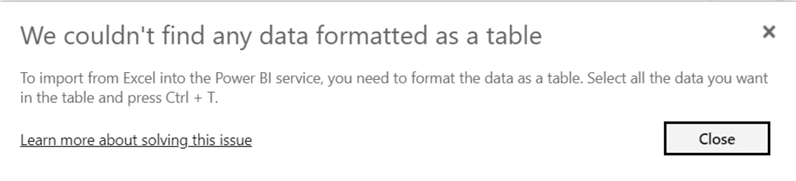
The data will then be imported into a Power BI dataset (more info on those in part 1 of this tip):
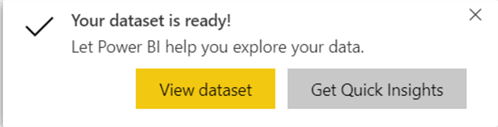
The result can be found in the datasets section of your workspace:
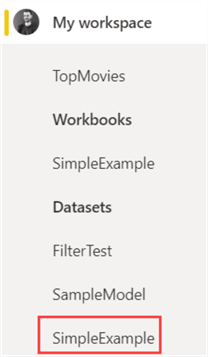
When you click on the dataset, you can explore it and create a new report on top of it:
Other sources of Data
We’ve taken a look on both the import and upload option for an Excel workbook where the data itself is stored in a table. But there are other possible data sources as well, such as a Power Pivot model or a PivotTable with a connection to an Analysis Services instance. In the following sections, we’ll explore those options.
Power Pivot Model
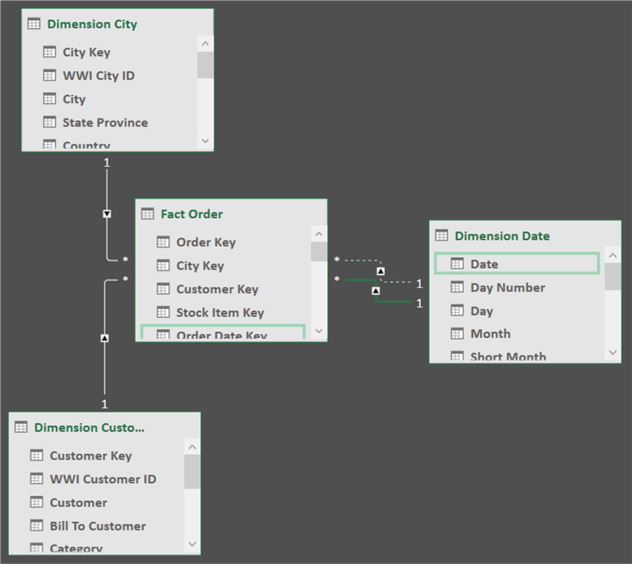
The Power Pivot model – which is now known as the Excel Data Model – has been around for quite some time now. It’s basically the same model as a Power BI dataset, but in Excel. For an introduction, please read the tip Introduction to PowerPivot for Excel and SQL Server. Suppose we have the following model created in Power Pivot (the Excel file containing the model can be downloaded from here):
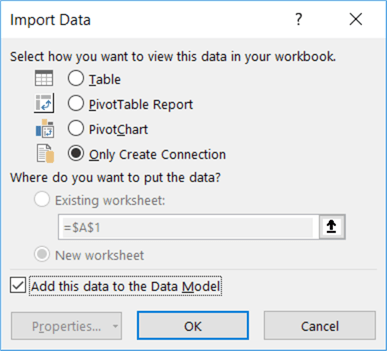
Keep in mind you can create a model without actually importing all of the data inside Excel worksheets by using the following options:
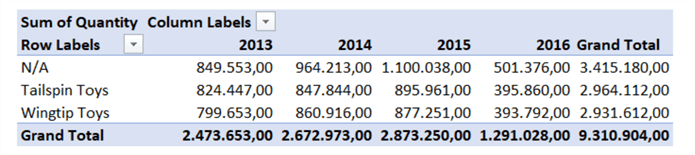
Using the model, the following PivotTable was created:
When we upload the workbook to the Power BI service, the PivotTable is kept as-is. The data itself from the Power Pivot model is also present, albeit you can’t see it.
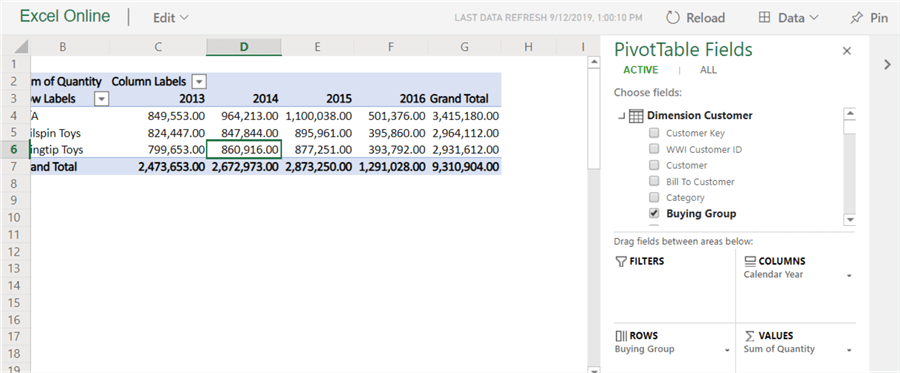
The PivotTable can be modified and you can browse the model like you want. You might want to click on All in the PivotTable field list to show all possible fields, otherwise only the tables used in the PivotTable are shown.
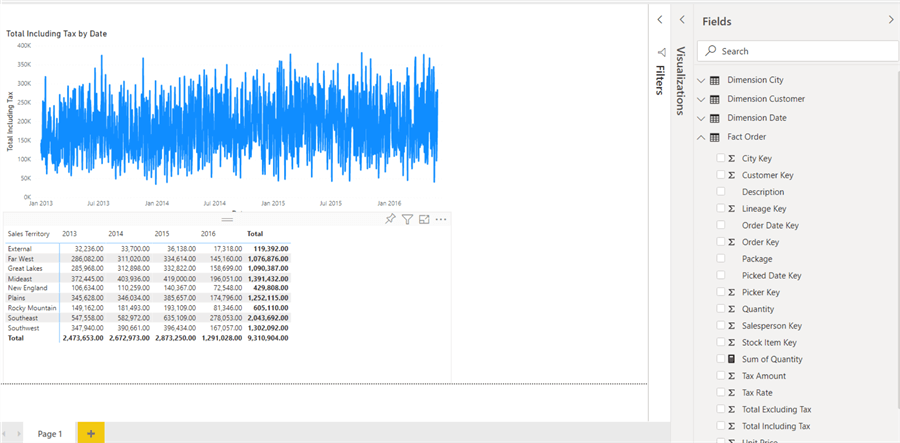
On the other hand, when we import the workbook, the Power Pivot model will be converted to a Power BI dataset, including all the relationships, measures etc. you defined. There you can create reports using the full Power BI experience.
Live Connection to SSAS
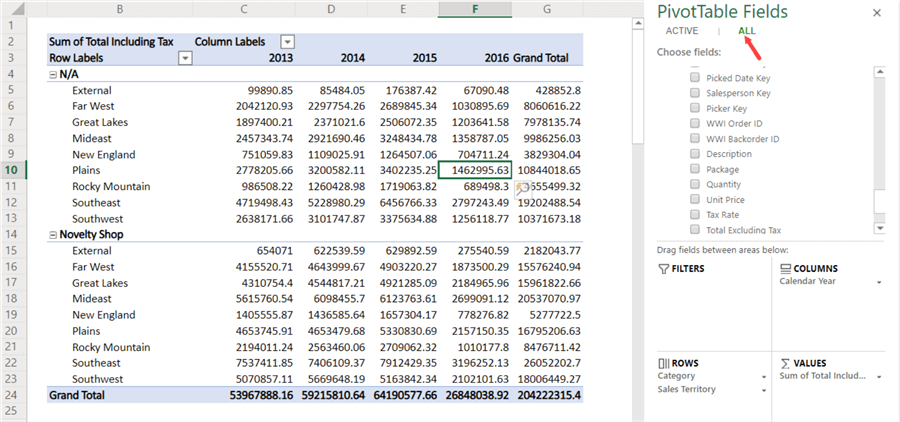
Our last workbook has a live connection to a SSAS Tabular instance (hosting a model containing data from the Wide World Importers sample database):
We can upload the workbook to the Power BI service, but modifying the PivotTable might not be possible since we’re using an external connection to an on-premises data source:
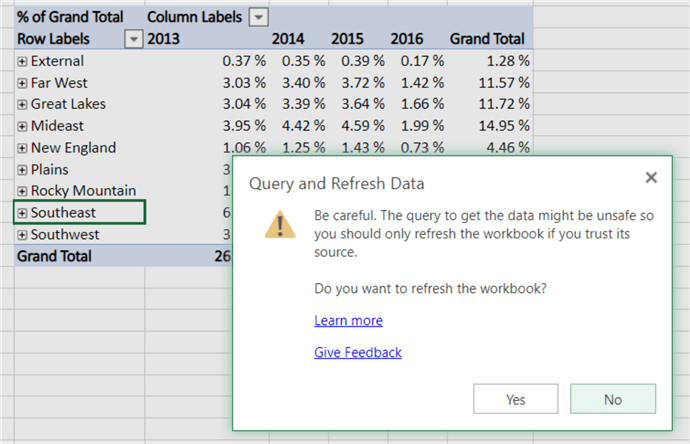
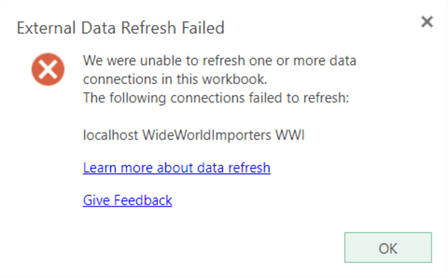
Depending on the type of external data source used or gateways configured, this refresh might fail:
A better option would be to create the live connection in a Power BI Desktop file.
Workbooks and Datasets: A Compromise?
Most users have little trouble working with Excel; in fact, some users might even prefer Excel over other tools for reporting. But Power BI datasets have much more power and flexibility over a traditional Excel file. They are even better than Power Pivot models, since Power BI Desktop is updated more frequently and has the latest updates for the DAX language, relationships and other features. Is it possible to combine the best of both worlds? Luckily, we can.
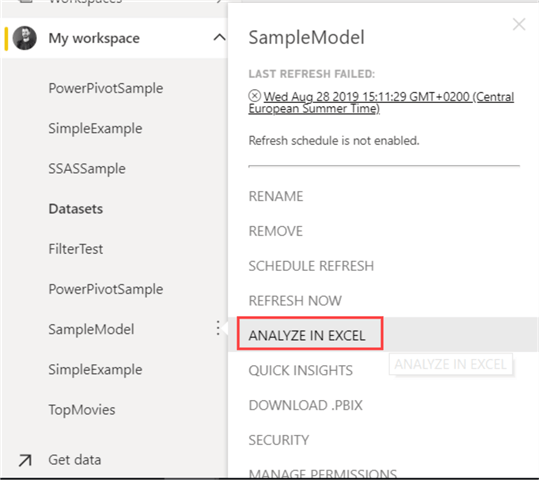
With the Analyze in Excel feature, we can use Excel as a front-end client – which most people know how to work with – while at the back-end we have a Power BI dataset providing us with full flexibility and scale. How does it work? For any published dataset, you can simply right-click it and choose Analyze in Excel.
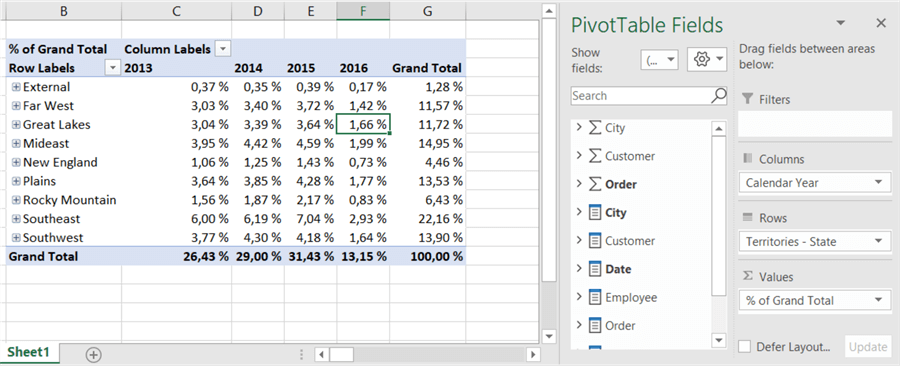
This will make you download a .odc file (Office Data Connection) to your machine. When you double-click it, Excel will open (the first you might be asked to install some additional software). You will end up with a PivotTable, directly connected to the dataset in the Power BI service:
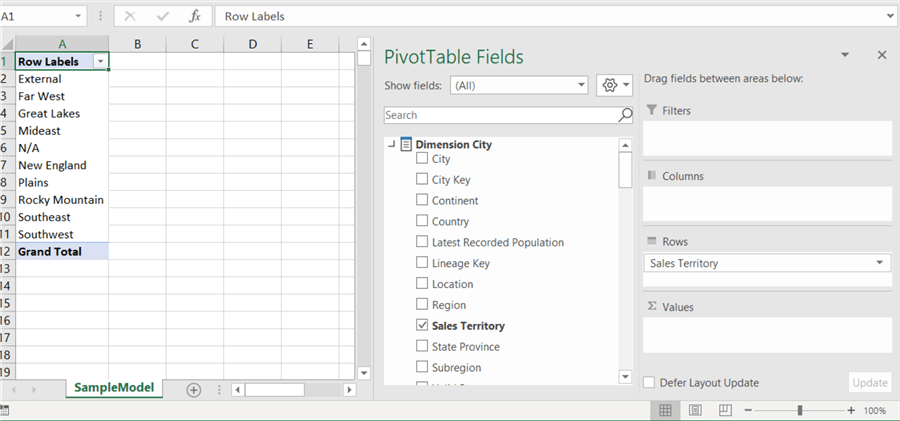
Now you can use Excel to browse the data. This is similar to using Power BI desktop to connect to a Power BI dataset, as demonstrated in part 1.
Conclusion
In part 2 of this tip we gave an introduction to the role Excel workbooks can play in the Power BI ecosystem. Basically, there are two choices: either you upload the workbook so you can view it in Excel Online, or you import the workbook so it is converted into a Power BI dataset. Depending on the type of data or the storage location, it’s possible to refresh the data.
As a hybrid combination, you can use the Analyze in Excel feature to create a PivotTable in Excel directly connected to a Power BI dataset.
Which option would be the best for your scenario?
- If you already have reporting in Excel and you want to share it with colleagues with minimum effort, importing the workbook as-is is your choice.
- In all other cases, using Power BI Desktop to create a dataset is the preferred choice. Even if you have a dataset in Excel, importing it in Power BI Desktop gives you maximum flexibility. You can for example combine that dataset with other data sources to enrich the data. You also have the latest features of the M and DAX language.
Next Steps
- You can download the sample files here.
- If you haven’t already, check out part 1 for an introduction to datasets.
- You can find more info on Excel workbooks in Power BI in the docs article Get data from Excel workbook files.
- Official documentation on data refresh.
- You can find more Power BI tips in this overview.

Koen Verbeeck is a seasoned business intelligence consultant with over a decade of experience with the Microsoft Data Platform. He holds several certifications, including Azure Data Engineer. He’s a prolific writer, with over 375 articles on technologies such as Microsoft Fabric, SSIS, ADF, SSAS, SSRS, MDS, Power BI, Snowflake and Azure services. He has spoken at various events such as PASS, SQLBits, dataMinds Connect and many others. He frequently delivers educational webinars on MSSQLTips.com. For his efforts, Koen has been awarded the Microsoft MVP data platform award for many years.
- MSSQLTips Awards:
- Leadership Award (200+ Tips) – 2021
- Author of the Year – 2014/2020/2022
- Author Contender – 2024/2025


